The research was intended to study the influence of human and industrial activities on the Orashi River. Three groups are observed to have impacted the environment – Oil/gas industries, tyre burning from abattoir, untreated human and animal waste from settlers and the abattoir. The mean concentrations of the parameters studied in some samples were close to or exceeded World Health Organization (WHO) and Federal Ministry of Environment (FMEnv) recommended limits for drinking water and seafood. The results from this study showed the value range of pH(6.2-7.4), DO(3.28-5.69), BOD(1.13-4.14), TDS(6-64mg/l), Salinity(0.06-0.09), conductivity(11-122), Turbidity (13.5-61.6), Temperature (28.89-32.9) and nutrient-AVP(0.64-2.4), SO4(1-2.52), NO3(0.61-1.32mg/l) in surface water and sediment nutrients–AVP (0.35-3.98), SO4(0.7-6.12), NO3(0.825-3.64mg/kg). The physicochemical parameters were typical of the tropics with spatial seasonal variations. Highest values were at the peak of the dry season for pH, ORP, DO, TDS, Salinity, Temperature and Sediment AVP while BOD, Conductivity, Turbidity, AVP, SO4, NO3 in water and in sediment SO4 and NO3 was highest during the rainy season. The analysis of variance (ANOVA) results show that there is significant difference at P< 0.05 between record obtained in the rest of the months and stations sampled during the period for pH, ORP, Temperature, Conductivity, water nutrient parameters and sediment SO4 and NO3 while there is no significant difference at P< 0.05 for DO, BOD, TDS, Salinity and Turbidity in the parameters analyzed.
Key findings:
The study evaluated the impact of human and industrial activities on the Orashi River, highlighting contamination from oil/gas industries, tyre burning, and untreated waste. Water and sediment analysis revealed levels of pH, DO, BOD, TDS, Salinity, conductivity, Turbidity, Temperature, and nutrients exceeding WHO and FMEnv limits, indicating significant environmental degradation.
What is known and what is new?
Prior to this study, the specific influence of human and industrial activities on the Orashi River had not been extensively characterized. This research identifies key sources of contamination, including oil/gas industries, tyre burning, and untreated waste, highlighting their impact on water quality. The study also provides detailed data on the physicochemical parameters of the river, contributing to a better understanding of environmental degradation in the region.
What is the implication, and what should change now?
The implications of this study are significant for environmental management and public health. The findings indicate a pressing need for stricter regulations and enforcement to control human and industrial activities that degrade water quality. Immediate action is needed to mitigate the impact of pollution on the Orashi River, including improved waste management practices and monitoring to ensure compliance with water quality standards.
Water is the most important natural resources and there are many conflicting demand for them. Skillful management of water bodies is required if they are to be used for such diverse purpose as domestic and industrial supply, crop irrigation, transport, recreation, sports, commercial fisheries, power generation and waste disposal. Fishes are dependent on the water as a medium in which to live. All vital metabolic functions of fish such as respiration, feeding, movement, growth and reproduction are all dependent on water. Water is therefore the high way, byway, communication medium, nursery, play ground, school, room, bed, drink, toilet and grave for a fish.
Water bodies are vulnerable to contamination accident and bioterrorism attacks because they are relatively unprotected, easily accessible, often isolated and their various use by human pre-disposes them to contamination [1]. Environmental exposure to toxic metals is a critical issue in environmental and public health. The modern world is aware of the relationship between water and water borne diseases as a vital public health issue [2-5].
Water bodies can be fully characterized by three major components – hydrology, physic-chemistry and biology. A complete assessment of the quality of any water body is based on appropriate monitoring of these components [6]. Each freshwater body has an individual pattern of physical and chemical characteristics which are determined largely by the climatic geomorphologic and geochemical conditions prevailing in the drainage basin and the underlying aquifer. There are several human activities which have indirect and undesirable, if not devastating effects on the aquatic environment.
Pollutants in aquatic systems occurs where industrial wastes are discharge, petroleum production and refining, gas flaring, gas processing plants and conveyance pipelines [7-9]. These effluents discharge and atmospheric emissions from flow stations and refineries often settle in the aquatic environment. When contamination reaches levels in excess of the assimilative capacity of the receiving waters, they may affect the survival, reproduction capacity, growth and behavioral condition of organisms. [10,11,4]. They are taken up by aquatic organisms and passed up the food chain through the process known as bio-magnification.
The Orashi river is a non-tidal freshwater of the lower Niger basin that runs through some communities in Imo State and Ogba/Egbema/Ndoni LGA in Rivers State. The natural aquatic habitat of Orashi River of ONELGA may have changed as a result of the intense industrial activities, oil exploration and exploitation, clearing of bank vegetations, annual dredging of the river to contain flooding, construction of roads and bridges, drains and embankment walls. It is therefore imperative to conduct this study and determine if the level of some physic-chemical parameters of the surface water and the sediment components of the area are affected by the observed human activities going on in the area. The data generated will serve as baseline information for subsequent monitoring studies and for management of the environment and its resources.
AIM
Investigation of the physicochemical parameters of Orashi River to ascertain the status and level of pollution of the River
OBJECTIVES
The specific objectives include:
(1) To determine the suitability of Orashi River for sustaining aquatic life (Flora and fauna), drinking and for irrigation purposes by human
(2) To determine the status and level of pollution in comparison to established standards.
The study area is Ogba/Egbema/Ndoni LGA in Rivers State of Nigeria. (Fig: 1a, b & c). The area has a number of oil wells and major flow stations within the Niger Delta region of Nigeria. Nigerian Agip Oil Company (NAOC) and Total E & P Nigeria Limited explores, exploit crude oil and flare gases indiscriminately in the area at Ebocha, Obrikom and Obitte. The inhabitants of the area are predominantly farmers and fishermen which is their basic source of livelihood. The area has a growing population of 283, 294 in 2006 and a projection of 398,000 in 2016 (National population commission of Nigeria (web), National Bureau of statistics (web). The site is Orashi river, a non-tidal freshwater of the lower Niger basin that runs through some communities in Imo State, Egbema, Ndoni, and Ogba communities in Rivers State and empties into Sombreiro river in Ahoada.
Fig 1: maps showing the study area
SAMPLING STATIONS
A reconnaissance survey was carried out in the study area on March, 2019 and then sampling stations were established at five locations along the Orashi River, 5km distance from each other using Global positioning system navigator (GPS) as shown in table 1 and represented by station 1 – 5.
Table 1: Geographical positioning system (GPS) -GPS-Grami 785
STATIONS | LOCATIONS | COORDINATES | ELEVATION |
Station 1 | Okwuzi | N05029’08.3” E006042’26.3” | 21M |
Station 2 | Ebocha | N05027’49.3” E006042’06.6” | 24M |
Station 3 | Ndoni | N05027’24.6” E006040’27.8” | 12M |
Station 4 | Obrikom | N05023’31.0” E006039’03.0” | 22M |
Station 5 | Omoku | N05020’18.7” E006038’34.6” | 16M |
COLLECTION OF WATER SAMPLES
Water samples were collected from all stations at a depth of 15-25cm with pre-rinsed containers according to the respective water quality parameters to be determined for twelve (12) sampling periods (September 2019 to August 2020).
(i) 1 liter white plastic containers were used for the collection of samples for some physicochemical parameters
(ii) 250ml dark colored reagent glass bottle were used in collecting water sample for BOD and DO analysis.
(iii) Some water quality parameters are known to vary with time and condition and were therefore measured in the field (in-situ) using suitable calibrated field instruments and appropriate method - standard methods for examination of water and waste water [12]. These are: pH, Turbidity (NTU), Total dissolved solids (TDS), Conductivity, Dissolved oxygen (mg/l), Surface water temperature (oC) and Salinity (%O)
COLLECTION OF SEDIMENT SAMPLE
Sediment samples were collected at each of the five (5) sampling stations for the specified period using BENTHIC GRAB of about 1.0cm3.
Samples were put in polythene bags and in a cooler and transported to the Institute of Pollution Studies (IPS) laboratory of Rivers State University, Port-Harcourt for analysis.
LABORATORY ANALYSIS OF SAMPLES
In the laboratory, the following analysis was done on the samples collected.
(i) Biochemical Oxygen Demand (BOD) (Mg/L): The BOD is the amount of dissolved oxygen in the water consumed by micro-organisms in the process of breaking down organic matter. DO was measured in-situ with a DO meter and an initial DO value was recorded. Some portion of the diluted sample was incubated for 5 days at 20 1ml each of muller 1 & II solution were added to retard further biological actions and then final DO was measured. In other words, two DO determinations were carried out that is, one before incubation and the other, after incubation. The BOD value was then calculated as the difference between the initial DO value and the value after 5 days of incubation measured in Mg/L [13,12].
(ii) Analysis of Nutrients in Water Sample
*Sulphate in water (Mg/l): This was determined, using turbidometric test method. The analysis was performed by addition of sulferver 5 reagent powder pillow to 50ml of sample. The turbidity formed was measured with HACH spectrophotometer at the wave length of 420nm. The turbidity developed is proportional to the concentration of So4 present [14].
*Nitrate in water (mg/l): Brucine was added to 10ml of sample and reaction between nitrate and brucine produced a yellow color that was used for calometric determination of nitrate. The intensity of the color was measured with HACH Spectrophotometer at a wavelength of 420nm [14]
*Phosphate in water (Mg/L): 50ml of water sample was put into 125ml Erlenmeyer flask. A drop of phenolphthalein indicator was added to the sample. The sample developed a red color and sulphuric acid was added to discharge the color.
10ml of combined reagent was added to the sample and swirled for proper mixing. It was left to stand for 10mintues and absorbance measured with spectrophotometer at 880nm wave length.
(iii) Sediment Sample Analysis
The following physicochemical parameters in sediments were monitored during the study period: Available phosphorus (AVP), Nitrate and Sulphate.
The sediment samples were air-dried at room temperature for 5 days and grounded into powdery form. 1g of each was digested with Equia-Regia (mixture of HCL and HNO3 in the ratio 3:1). The digestates were filtered with 20ml of de-ionized water and the filtrates were stored in clean acid-washed and appropriately labeled 30ml polyethylene sample containers for analysis by Atomic Absorption Spectrometric method [15,14].
DATA ANALYSIS
All statistical analysis and presentation of results was done using Microsoft excel and Minitab 16 software. Raw data was subjected to a two way analysis of variance (ANOVA) with replication using MINITAB.
The following results were obtained from the physic-chemical parameters monitored during the study period:
pH in surface water: The results of the analysis of pH in surface water is presented in appendix 1 and represented in fig 1. It ranged from 6.2 to 7.4 at the 5 stations sampled during the sampling period. The mean values recorded during the period is station 1 (6.8), station 2 (7.1), station 3 (6.8), station 4(6.9) and station 5(6.85).
Seasonally, dry season (6.91) was slightly higher than the rainy season (6.90).
The analysis of variance (ANOVA) results presented in appendix 5 shows that there is significant difference (p<0.05) between location and time for pH values obtained during the monitoring period (P = 0.009).
ORP in surface water: The results of analysis obtained for ORP is presented in fig 2 and range from 97.2 to 134.8 with the highest ORP in the month of September (208.3).
Seasonally, dry season (119) is higher than rainy season (112).
The analysis of variance (ANOVA) results show that there is significant difference at P< 0.05 between record obtained in the rest of the months and stations sampled during the period. P=0.002.
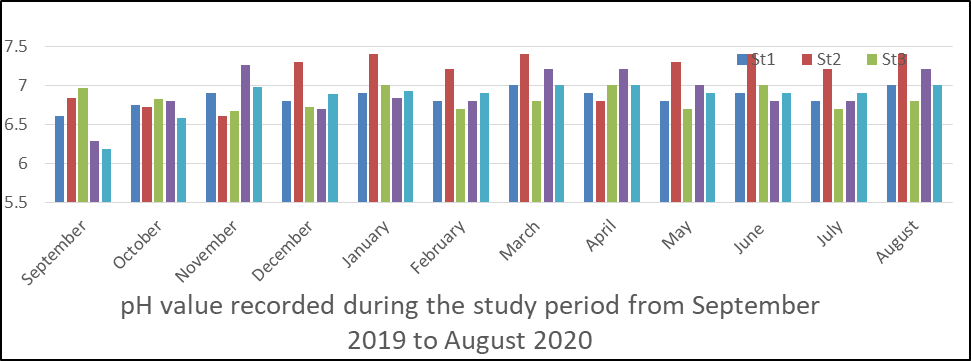
Fig 1 pH in water sample
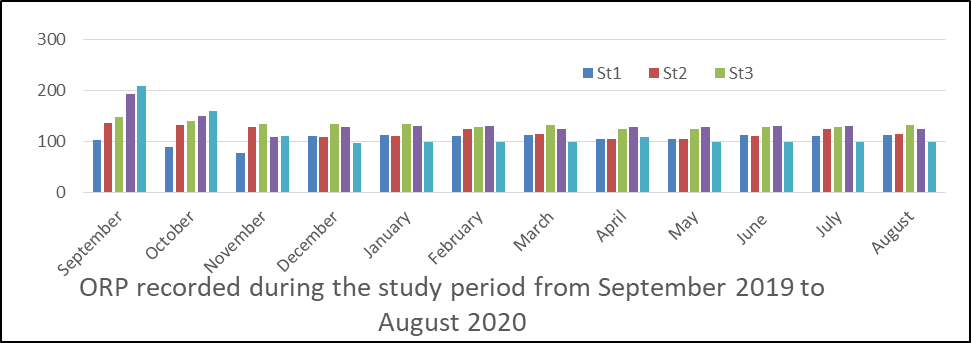
Fig 2 ORP in surface water
DO in surface water
Fig 3 shows the range for dissolved oxygen (DO) to be 3.28 to 5.69. The mean values were station 1(4.28), station 2(4.53), station 3(5.06), station 4(4.83) and station 5(4.88). The highest levels occur in September (5.69) in station 2 followed by station 3 (5.67).
The seasonal and spatial variations in DO as shown in fig 3 revealed that dry season (5.79) is higher than rainy season (4.75).
The analysis of variance result shows that there is no significant difference p< 0.05 between the record obtained in the month and station during the period p=0.057
BOD in surface water
The result obtained for BOD is presented in fig 4 and the value ranged from 1.13 to 4.14. The mean level obtained were station 1(2.74), station 2(2.80), station 3(3.13), station 4(2.88) and station 5(2.83).
Seasonally, the mean value for rainy season (3.17) is higher than that obtained for dry season (2.65).
In the analysis of variance (ANOVA) there is no significant difference (p< 0.05) for BOD in the water between time and location during the study period (P=0. 337).
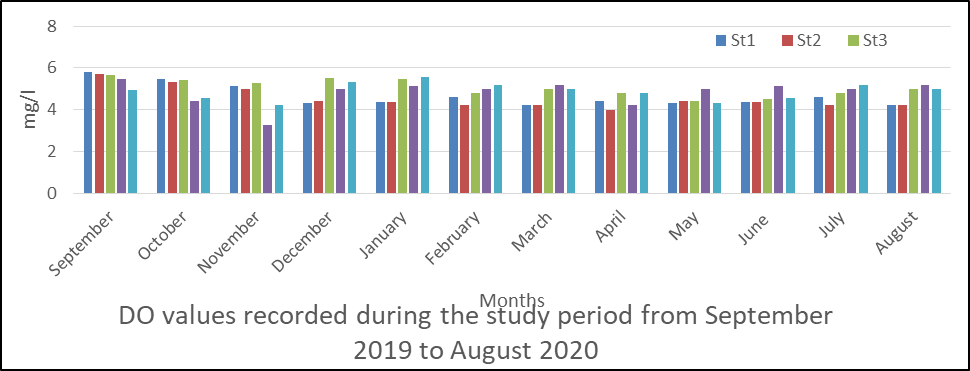
Figs 3 DO in surface water
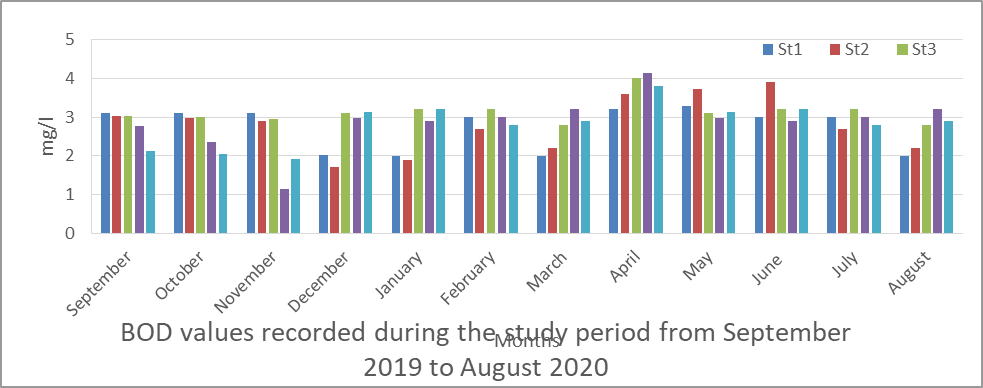
Fig 4 BOD in surface water
Conductivity in surface water
The result of analysis obtained for conductivity is presented in fig 5 and the value ranged from 11to122. The mean values for conductivity measurements were station 1(81), station 2(59.3), station 3(41.9), station 4(45.4) and station 5(56.9).
The seasonal and spatial variation shows a higher value in the rainy season (59.8) than the dry season (55.7).
The analysis of variance (ANOVA), indicated that there was significant difference between time (month) at p<0. 05 for conductivity value obtained during the monitoring period. P=0.042.
Salinity in surface water
The result of analysis obtained for salinity is presented in fig 6 and ranged from 0.0 6 to 0.09mg/l. The mean values for salinity measurements were station 1(0.025), station 2(0.0125), station 3(0.0125), station 4(0.03) and station 5(0.02mg/l). The measurement according to months is also shown in fig 6 and recorded little variations with the highest values in January, February, in the five stations sampled.
The analysis of variance (ANOVA) indicated that there was no significant difference at p <0.05 for salinity values obtained during the monitoring period P=0.887.
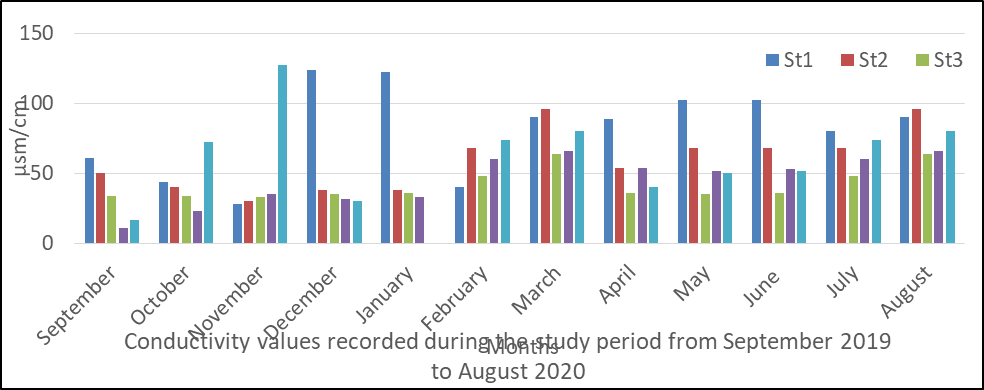
Fig 5: Conductivity in surface water
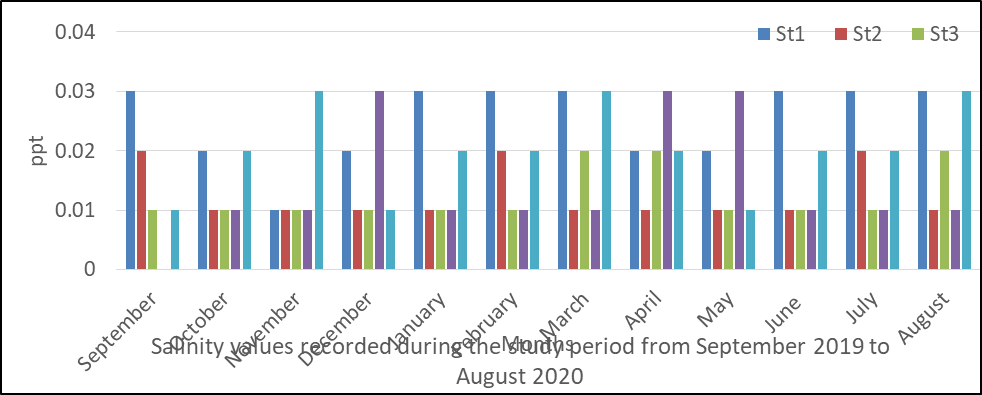
Fig 6: Salinity in surface water
TDS in surface water
The result of analysis obtained for TDS is presented in fig 7 and ranged from 6 to 64mg/l.
The mean values for TDS measurements were station 1(28.57), station 2(24.03), station 3(17.55), station 4(4.99) and station 5(22.35mg/l).
The measurement according to months is also shown in fig 7 and recorded the highest values in December and February in the five stations sampled.
The analysis of variance (ANOVA) indicated that there was no significant difference between time (month) at p <0.05 for TDS values obtained during the monitoring period P=0.825.
Turbidity in surface water
The result of analysis obtained for turbidity is presented in fig 8 and ranged from 13.5 to 61.6mg/l during the monitoring period.
The mean values are station 1(24.89), station 2(27.38), station 3(27.32), station 4(22.94) and station 5(23.34mg/l).
The result of the variations shows that rainy season had higher mean value than dry season. The highest turbidity value recorded during the period occurred in September.
The analysis of variance (ANOVA) results shows that there is no significant difference (P <0.05) between the values recorded for each water sample over time during the monitoring period (P=0.056).
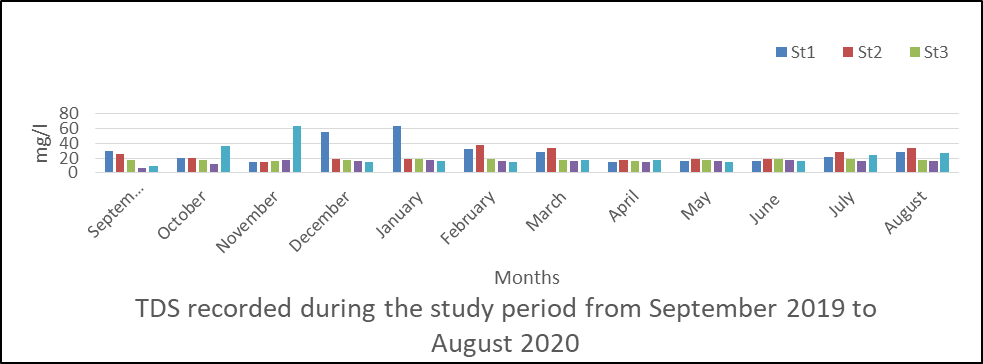
Fig 7: TDS in surface water
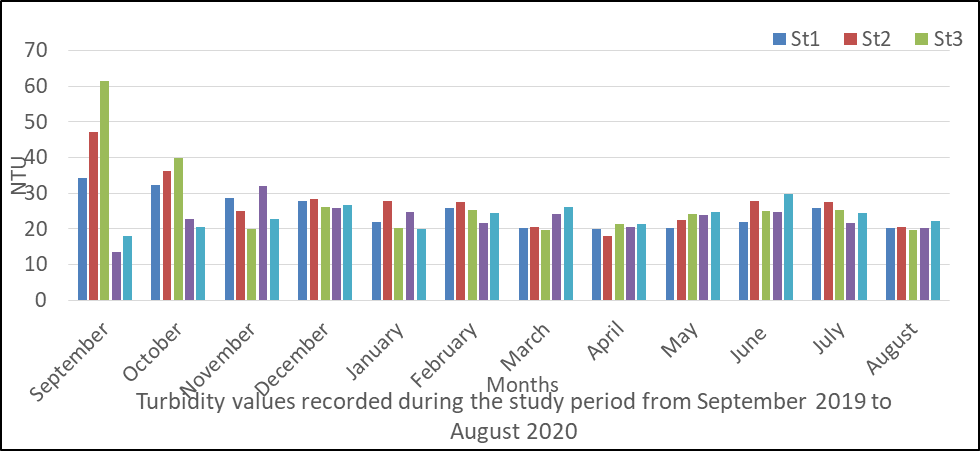
Fig 8: Turbidity in surface water
Temperature in Surface Water
The spatial changes in temperature are presented in fig 9. Generally there was fluctuation in temperature values of the river water during the monitoring period and ranged from 28.89 to 32.4. The mean values are station 1(29.78), station 2(30.87), station 3(28.97), station 4(30.29) and station 5(29.98oC).
The result of the variations shows that dry season (32.4) had higher mean value than rainy season (27.7).
The analysis of variance (ANOVA) results shows that there was significant difference (P <0.05) in the temperature values obtained during the monitoring period (P=0.056).
Phosphate in Surface Water
Fig 10 shows the result of phosphate levels in water which ranged from 0.64 to 2.4. The specific mean values were station 1(0.815), station 2(1.03), station 3(0.785), station 4(0.177) and station 5(1.27).
Seasonally, phosphate was observed throughout the monitoring period but the rainy season had higher mean value compared to the dry season.
The analysis of variance (ANOVA) results shows that there was significant difference (P <0.05) in phosphate values obtained during the monitoring period (P=0.001).
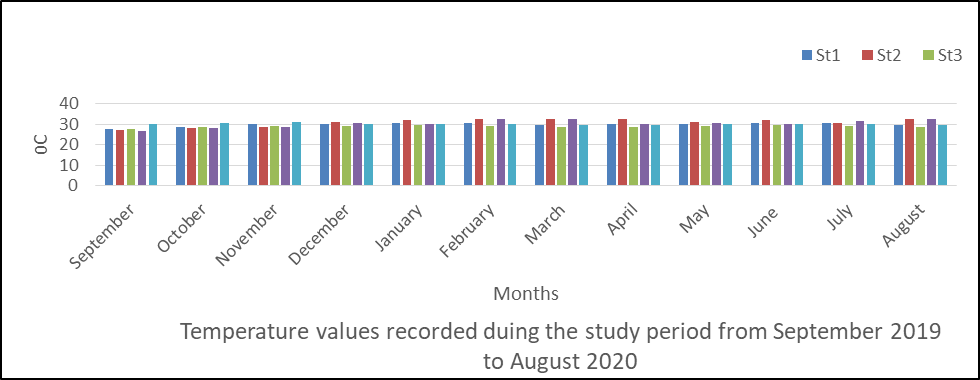
Fig 9: Temperature in surface water
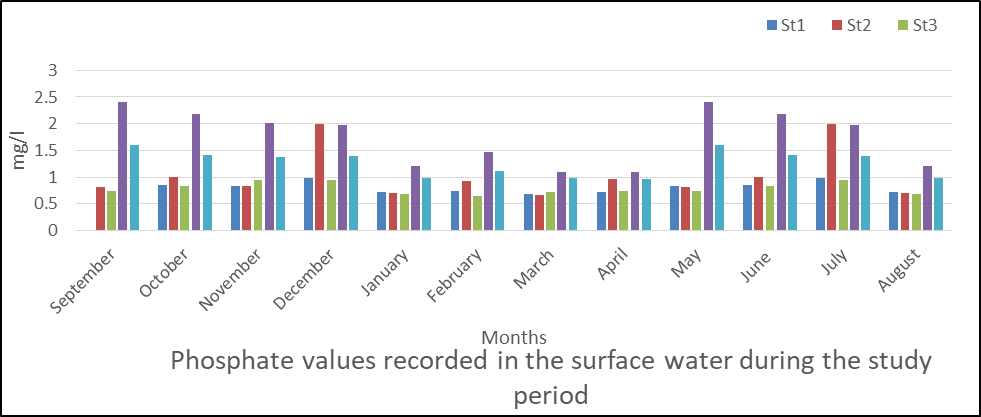
Fig 10: Phosphate in surface water
Sulphate in Surface Water
The results obtained in sulphate are presented in fig 11 and sulphate concentration ranged from 1 to 2.52mg/l. The mean values are station 1(1.83), station 2(1.95), station 3(1.29), station 4(1.88) and station 5(1.04).
For seasonal variation, rainy season tends to be higher than dry season in the five stations sampled. Fig 11 also shows the concentration in months with highest values in September and May followed by November.
The analysis of variance (ANOVA) shows significant difference (p < 0.05) in sulphate values of the water samples during the sampling period (P=0,000).
Nitrate in Surface Water
The results of the analysis obtained for nitrate in water is presented in fig 12 with the nitrate values ranged from 0.61 to 1.32mg/l. The mean values are station 1(0.73), station 2(0.78), station 3(0.88), station 4(0.96) and station 5(1.04mg/l).
Seasonally, the rainy season recorded a higher mean value than the dry season.
The analysis of variance shows that there was significant difference (P< 0.05) in nitrate values of water samples during the sampling period. (P=0.000).
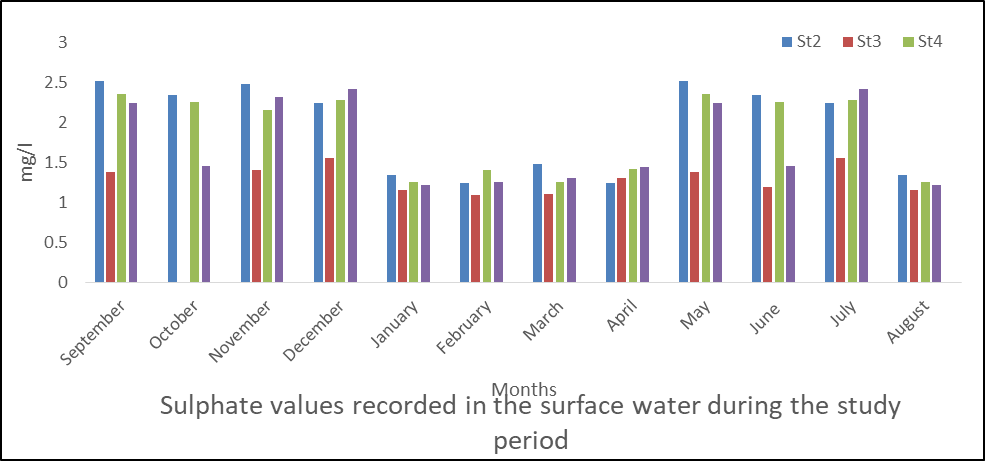
Fig 11: Sulphate in surface water
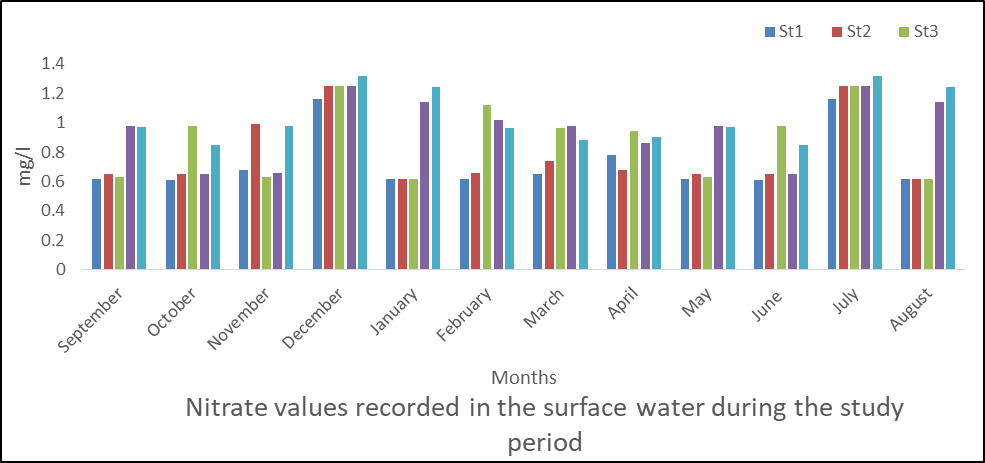
Fig 12: Nitrate in surface water
Available Phosphorus (AVP) in Sediment
Fig 13 shows the result of AVP in sediment which ranges from 0.35 to 3.98mg/kg. The specific mean values were station1 (2.25), station 2(3.08), station 3(3.12), station 4(3.56) and station 5(2.50). These values could be considered moderate and slightly below the permissible limit of 5mg/kg (FMENV, 2001).
Seasonally, the rainy season recorded a higher phosphate level than the dry season
The analysis of variance (ANOVA) shows that there is significant difference (P< 0.05) both in location and time (P=0.000).
Nitrate in Sediments
The result of nitrate levels in sediment is presented in Fig 14 with the values ranging from 0.825 to 3.64mg/kg. The mean values are station 1(1.65), station 2(1.80), station 3(2.90), station 4(1.92) and station 5(2.12). These values are within the permissible limit of 5mg/kg (FMEnv, 2001) [1].
Seasonally, rainy season recorded the highest value as compared to values recorded for dry season.
The result of analysis of variance (ANOVA) showed that there is significant difference (p< 0.05) between locations and time (p= 0.000).
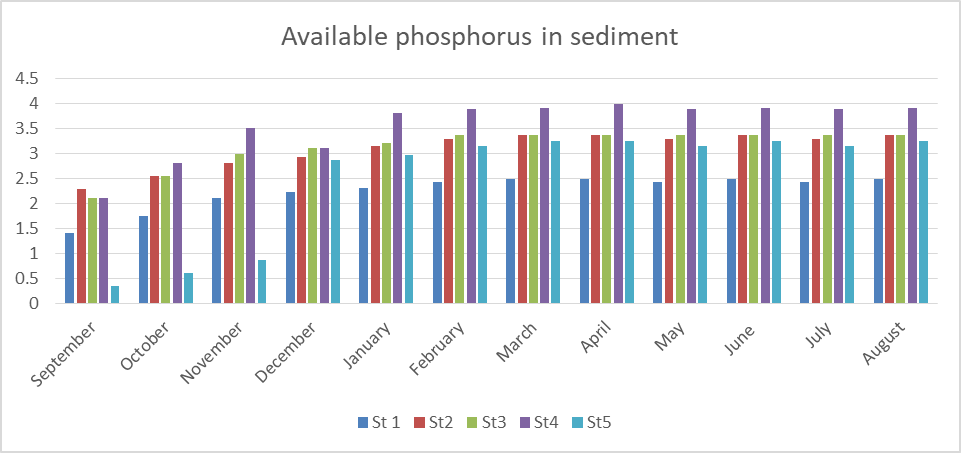
Fig 13: Phosphate in sediment
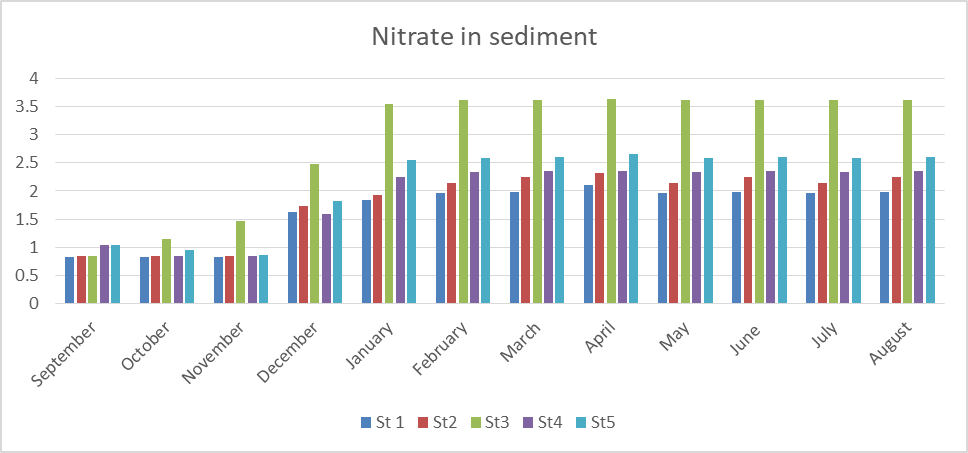
Fig 14: Nitrate in Sediment
Sulphate in Sediment
Fig 15 shows the result of sulphate in sediment which ranges from 0.7- 6.12mg/kg. The specific mean values were station 1(3.42), station 2(3.05), station 3(2.34), station 4(5.51) and station 5(2.05). These results indicate moderate level of sulphate in accordance with the FMENV (1999) permissible level in sediment of < 5mg/kg.
Seasonally, the rainy season recorded a higher sulphate level than the dry season in the 5 stations sampled. The highest value was observed in April in all the stations.
The analysis of variance (ANOVA) shows that there is significant difference (P< 0.05) both in location and time (P=0.002).
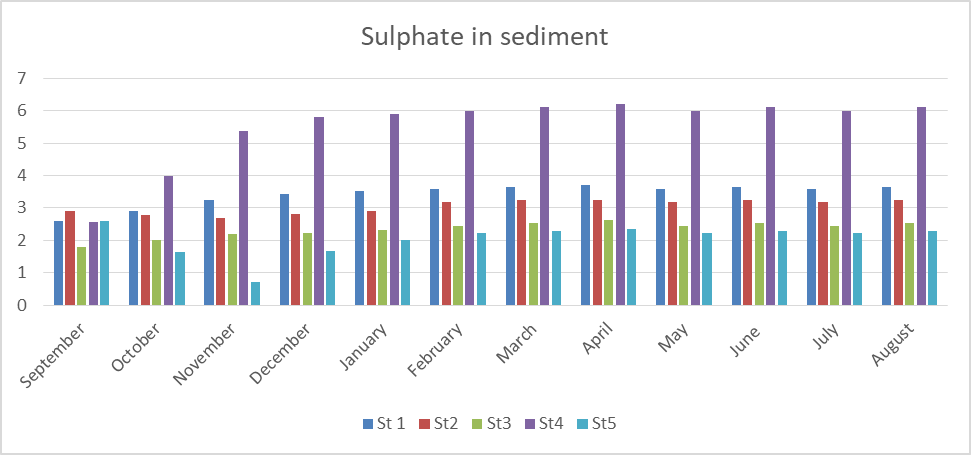
Fig15: Sulphate in Sediment
Water analysis (Physicochemical parameters)
The status of the Orashi River was obtained by monitoring the physical and chemical parameters of the river. Three groups are observed to have impacted the environment – Oil/gas industries, tyre burning from abattoir, untreated human and animal waste from settlers and the abattoir. The results from this study have provided information on the physicochemical parameter of water and sediment characteristics of Orashi River which were typical of the tropics with spatial seasonal variations. Highest values were at the peak of the dry season except BOD, Conductivity, Turbidity, AVP, Nitrate, Sulphate, sediment sulphate and nitrate which were at the peak in rainy season.
The results fall within the recommended range suitable for organism’s wellbeing and survival (FMENV 1992) and similar to records obtained by Ogamba, et al., (200518)[16] in the Bonny Estuary, Jacinta and Okwodu (201712) [17] in Oloshi river of Egbema, Imo State.
*DO LEVEL: The result of the present study indicate that DO level were low (3.28 -5.56mg/l) below the permissible limit of 5.0mg/l, therefore aquatic life is put under stress.
*ELECTRICAL CONDUCTIVITY: The values obtained from Electrical conductivity show that Orashi River is good for the survival of living organism and the water is suitable for irrigation.
*TDS LEVEL: TDS values obtained during the study range from 6 – 64mg/l and these values were too low and well below the FMENV maximum limits of 2,000mg/l but do not pose any risk.
*TURBIDITY LEVEL: The turbidity measurement of Orashi River from all the stations sampled was far above the WHO (198925) and EEC (20057) [18,19] drinking water standard of 5NTU.The high turbidity values may be attributed to suspended silt, clay, organic matter and plankton (Philip et al., 200622) [20] as a result of dredging activities and yearly channelization of the River to avert flood in the area by the oil companies.
*TEMPERATURE: The water temperatures were typical of the tropics and within the maximum permissible limit of < 40oC FMENV (20019). Similar regimes were recorded by Lawal-Are, et al., (201014) [21] in the tidal creek in Lagos.
*NUTRIENT IN WATER: The study shows that nitrate, sulphate and phosphate level in water is within the FMENV (20019) and WHO (198925) [18,1] maximum permissible limit of 10mg/l, 250mg/l respectively and 5mg/l by FMENV (20019) [1] for phosphate. Similar results were reported by Johnson, et al., (199713); Akan, et al., (20101); Ekweozor and Agbozu (20015b) [22-24]. The values of these nutrients in water do not pose any environmental threat as they were lower than the FMEnv limit.
*SEDIMENT NUTRIENTS – Phosphate, sulphate and nitrate values could be considered moderate and slightly below the permissible limit of 5mg/kg (FMENV, 20019) [1]. This could be attributed to intense industrial activities, indiscriminate gas flare, Agricultural activities, abattoir location and discharge of household effluent.
The research was intended to study the influence of human and industrial activities on the Orashi River. At least three groups were observed to have impacted the environment – Industries (oil/gas Company), tyre burning from abattoir, untreated human and animal waste from settlers and the abattoir. The results from this study have provided information on the physicochemical characteristics of the river and sediment of Orashi River. The average mean concentrations of the parameters studied in some samples were close to or exceeded World Health Organization (WHO) and Federal Ministry of Environment (FMEnv) recommended limits for drinking water and seafood of the dry season. A close look at the observation in this non-tidal freshwater revealed that the pollution events in the study area are likely to have severe but localized effects, except during the rainy season when the pollutants are spread by flood into wider areas.
RECOMMENDATION
The aquatic resources have also been shown to be the habitat of biota and major source of livelihood to the indigenous community who are exposed to the hazardous effects of pollutants from industries. It is therefore recommended that:
The companies, industries and abattoir operating in the area should adopt improved waste management plans to reduce the levels of the pollutants discharge in the environment.
Comparative studies of the biota of the environment would be useful to monitor the rate and mechanism of uptake of pollutants in fish and plants of Orashi River.
Periodic monitoring and preventive measures are required to save the aquatic system from eutrophication.
The local communities should be enlightened about the adverse effects of anthropogenic activities, oil pipeline vandalization/sabotage and bunkering activities without consideration of the environmental effects.
Conflict of Interest
The authors declare that they have no conflict of interest.
Funding: No funding sources
Ethical approval: The study was approved by the Institutional Ethics Committee of FCE (T), Omoku, Rivers State
FMEnv (2001). National Guidelines and standard for waste water quality in Nigeria. FMEnv. Lagos Nigeria
World Health Organization (WHO) (1997): Health and environment, in Sustainable Development. Five years after the Earth Summit. World Health organization, Geneva, WHO/EHG/97.8.p245
Asonye, C. C., et al. "Some physico-chemical characteristics and heavy metal profiles of Nigerian rivers, streams and waterways." (2007): 617-624. https://www.cabidigitallibrary.org/doi/full/10.5555/20073185388
Gullick, Richard W., et al. "Design of early warning monitoring systems for source waters." Journal‐American Water Works Association 95.11 (2003): 58-72. https://doi.org/10.1002/j.1551-8833.2003.tb10493.x
Meybeck, M., et al. "Rivers." Water quality assessments: a guide to the use of biota, sediments and water in environment monitoring, Chapman edition, 2nd ed. E & FN Spon, London (1996): 59-126.
Izonfuo, L. W. A., and A. P. Bariweni. "The effect of urban runoff water and human activities on some physico-chemical parameters of the Epie Creek in the Niger Delta." Journal of Applied Sciences and Environmental Management 5.1 (2001). DOI: 10.4314/jasem.v5i1.54941
Ellgaard, E. G., and T. W. Rudner. "Lead acetate: toxicity without effcts on the locomotor activity of the bluegill sunfish, Lepomis macrochirus Rafinesque." Journal of Fish Biology 21.4 (1982): 411-415. https://doi.org/10.1111/j.1095-8649.1982.tb02846.x
Chukwu, L.O and Odunzeh, C,C (1993). Toxic and Sublethal effects of spent lubricants oil on the gill morphology of the tropical Teleost orechromis niloticus. Journal of Nigerian Environmental Society. Vol. 1 (3) 334-339.
APHA-AWWA-WEF (2005) Standard methods for the examination of water and waste Water (20th ed) Greenberg A.E and Eaton, A.D (Eds). American Public Health Association, Alexandria, American water works Association, water Environment Federation, Washington DC
Narayan, P. (2007). Chemical methods in environmental pollution analysis-metals in: Environmental Pollution: Principles, Analysis and control. Publish CBS. New Delhi, Bangalove India.
Rice, Eugene W., Laura Bridgewater, and American Public Health Association, eds. Standard methods for the examination of water and wastewater. Vol. 10. Washington, DC: American public health association, 2012. https://yabesh.ir/wp-content/uploads/2018/02/Standard-Methods-23rd-Perv.pdf
Odu, C. T. I., et al. "Environmental Study of the Nigerian AGIP Oil Company Operational Areas: Soils and Fresh-water vegetation." Milan, Italy (1985): 22-25.
Ogamba, E. N., et al. "Impact of human activities on plankton of the Niger Delta Nigeria." Niger Delta Biologia 5.1 (2005): 1-9.
Jacinta, O.A and Okwodu, N.E (2017). Environmental Health Determination and Assessment of Physicochemical characteristics of Oloshi Rivers in Nigeria. FUW Trends in Sciences and Technology journal. www.firstjournal.com e-ISSN: 24085162:p-ISSN:20485170. 2(18), 585-590
IPCS, OMS. "Environmental Health Criteria 61: Chromium." World Health Organization, International programme on Chemical Safety(IPCS). Geneva. htpp://www. inchem. org/fullist. htm (1988).
European Economic Commission (EEC) (2005). Commission Regulation (EC) No.78/2005 (pp. L16/43El 16/45) Official journal of European Union.
Tropical, Associated Faunal Species Of A. "The Water Chemistry, Crustacean Zooplankton And Some Associated Faunal Species Of A Tropical Tidal Creek In Lagos, Nigeria." The Journal of American Science: 81. https://www.academia.edu/download/16893597/am0601.pdf#page=98
Johnson, D.L, Ambrose, S.H & Winter-Nelson, A. E (1997). Meanings of Environmental terms. Journals of Environmental quality, 25, 581-591.
Akan, Joseph C., Fanna I. Abdulrahman, and Emmanuel Yusuf. "Physical and chemical parameters in abattoir wastewater sample, Maiduguri Metropolis, Nigeria." The Pacific Journal of Science and Technology 11.1 (2010): 640-648. https://citeseerx.ist.psu.edu/document?repid=rep1&type=pdf&doi=421a30cf40db8f8467e1b43ddacdae73a7e3e155
Ekweozor, I. K. E., and I. E. Agbozu. "Surface water pollution studies of Etelebou oil field in Bayelsa State, Nigeria." African Journal Sci 2 (2001): 246-254.
APPENDICES
APPENDIX 1: Physico-Chemical Parameter in surface water
pH | SEPT | OCT | NOV | DEC | JAN | FEB | MAR | APR | MAY | JUN | JULY | AUG |
St1 | 6.61 | 6.75 | 6.9 | 6.8 | 6.9 | 6.8 | 7 | 6.9 | 6.8 | 6.9 | 6.8 | 7 |
St2 | 6.83 | 6.72 | 6.6 | 7.3 | 7.4 | 7.2 | 7.4 | 6.8 | 7.3 | 7.4 | 7.2 | 7.4 |
St3 | 6.96 | 6.82 | 6.67 | 6.72 | 7 | 6.7 | 6.8 | 7 | 6.7 | 7 | 6.7 | 6.8 |
St4 | 6.29 | 6.8 | 7.26 | 6.7 | 6.84 | 6.8 | 7.2 | 7.2 | 7 | 6.8 | 6.8 | 7.2 |
St5 | 6.18 | 6.58 | 6.98 | 6.89 | 6.92 | 6.9 | 7 | 7 | 6.9 | 6.9 | 6.9 | 7 |
ORP | SEPT | OCT | NOV | DEC | JAN | FEB | MAR | APR | MAY | JUNE | JUL | AUG |
St1 | 103.2 | 90.1 | 77 | 111.6 | 113.2 | 110.4 | 113 | 104 | 105.6 | 113 | 110 | 113 |
St2 | 137.2 | 132.8 | 128 | 109.2 | 110.4 | 124.2 | 114 | 104 | 105.2 | 110 | 124 | 114 |
St3 | 147.6 | 140.7 | 134 | 134 | 133.6 | 128.2 | 132 | 124 | 124 | 129 | 128 | 132 |
St4 | 192.7 | 150.8 | 109 | 128.4 | 130 | 130.4 | 124 | 128 | 128.4 | 130 | 130 | 124 |
St5 | 208.3 | 159.8 | 111 | 96.7 | 100.2 | 98.8 | 100 | 108 | 99.7 | 100 | 98.8 | 100 |
DO | SEPT | OCT | NOV | DEC | JAN | FEB | MAR | APR | MAY | JUN | JUL | AUG |
St1 | 5.78 | 5.46 | 5.13 | 4.32 | 4.35 | 4.6 | 4.2 | 4.4 | 4.32 | 4.35 | 4.6 | 4.2 |
St2 | 5.69 | 5.32 | 4.98 | 4.4 | 4.38 | 4.2 | 4.2 | 4 | 4.4 | 4.38 | 4.2 | 4.2 |
St3 | 5.67 | 5.4 | 5.27 | 5.52 | 5.49 | 4.8 | 5 | 4.8 | 4.42 | 4.49 | 4.8 | 5 |
St4 | 5.45 | 4.4 | 3.28 | 5 | 5.12 | 5 | 5.2 | 4.2 | 5 | 5.12 | 5 | 5.2 |
St5 | 4.92 | 4.56 | 4.21 | 5.3 | 5.54 | 5.2 | 5 | 4.8 | 4.3 | 4.54 | 5.2 | 5 |
BOD | SEPT | OCT | NOV | DEC | JAN | FEB | MAR | APR | MAY | JUNE | JULY | AUG |
St 1 | 3.12 | 3.11 | 3.11 | 2.02 | 2 | 3 | 2 | 3.2 | 3.3 | 3 | 3 | 2 |
St 2 | 3.04 | 2.98 | 2.91 | 1.72 | 1.9 | 2.7 | 2.2 | 3.6 | 3.72 | 3.9 | 2.7 | 2.2 |
St 3 | 3.03 | 3 | 2.94 | 3.12 | 3.2 | 3.2 | 2.8 | 4 | 3.12 | 3.2 | 3.2 | 2.8 |
St 4 | 2.78 | 2.37 | 1.13 | 2.98 | 2.9 | 3 | 3.2 | 4.14 | 2.98 | 2.9 | 3 | 3.2 |
St 5 | 2.12 | 2.05 | 1.92 | 3.14 | 3.2 | 2.8 | 2.9 | 3.8 | 3.14 | 3.2 | 2.8 | 2.9 |
COND | SEPT | OCT | NOV | DEC | JAN | FEB | MAR | APR | MAY | JUNE | JULY | AUG |
St1 | 61 | 44 | 28 | 124 | 122 | 40 | 90 | 89 | 102 | 102 | 80 | 90 |
St2 | 50 | 40z | 30 | 38 | 38.2 | 68 | 96 | 54 | 68 | 68.2 | 68 | 96 |
St3 | 34 | 34 | 33 | 35 | 36 | 48 | 64 | 36 | 35 | 36 | 48 | 64 |
St4 | 11 | 23 | 35 | 32 | 33 | 60 | 66 | 54 | 52 | 53 | 60 | 66 |
St5 | 17 | 72 | 127 | 30 | 74 | 80 | 40 | 50 | 51.4 | 74 | 80 |
TDS | SEPT | OCT | NOV | DEC | JAN | FEB | MAR | APR | MAY | JUNE | JULY | AUG |
St 1 | 30 | 20.5 | 14.9 | 56 | 64 | 32 | 28 | 15 | 16 | 16.4 | 22 | 28 |
St 2 | 25 | 20 | 15 | 19 | 19.2 | 38 | 34 | 18 | 19 | 19.2 | 28 | 34 |
St 3 | 17 | 17 | 16 | 17 | 18.1 | 19 | 18 | 16.4 | 17 | 18.1 | 19 | 18 |
St 4 | 6 | 11.5 | 17 | 16 | 17.1 | 16 | 16 | 15.2 | 16 | 17.1 | 16 | 16 |
St 5 | 9 | 36.5 | 64 | 15 | 16.4 | 14 | 17 | 17 | 15 | 16.4 | 24 | 27 |
SALIN | SEPT | OCT | NOV | DEC | JAN | FEB | MAR | APR | MAY | JUNE | JULY | AUG |
St 1 | 0.03 | 0.02 | 0.01 | 0.02 | 0.03 | 0.03 | 0.03 | 0.02 | 0.02 | 0.03 | 0.03 | 0.03 |
St 2 | 0.02 | 0.01 | 0.01 | 0.01 | 0.01 | 0.02 | 0.01 | 0.01 | 0.01 | 0.01 | 0.02 | 0.01 |
St 3 | 0.01 | 0.01 | 0.01 | 0.01 | 0.01 | 0.01 | 0.02 | 0.02 | 0.01 | 0.01 | 0.01 | 0.02 |
St 4 | 0 | 0.01 | 0.01 | 0.03 | 0.01 | 0.01 | 0.01 | 0.03 | 0.03 | 0.01 | 0.01 | 0.01 |
St 5 | 0.01 | 0.02 | 0.03 | 0.01 | 0.02 | 0.02 | 0.03 | 0.02 | 0.01 | 0.02 | 0.02 | 0.03 |
TURB | SEPT | OCT | NOV | DEC | JAN | FEB | MAR | APR | MAY | JUNE | JULY | AUG |
St 1 | 34.2 | 32.3 | 28.7 | 27.92 | 21.8 | 25.8 | 20.2 | 19.8 | 20.2 | 21.8 | 25.8 | 20.2 |
St 2 | 47.2 | 36.1 | 25.1 | 28.41 | 27.84 | 27.4 | 20.4 | 18 | 22.41 | 27.8 | 27.4 | 20.4 |
St 3 | 61.6 | 40 | 19.8 | 26.2 | 20.12 | 25.2 | 19.6 | 21.2 | 24.2 | 25.1 | 25.2 | 19.6 |
St 4 | 13.5 | 22.8 | 32.1 | 25.75 | 24.6 | 21.6 | 24.2 | 20.6 | 23.75 | 24.6 | 21.6 | 20.2 |
St 5 | 18.1 | 20.5 | 22.8 | 26.6 | 19.82 | 24.4 | 26.2 | 21.2 | 24.6 | 29.8 | 24.4 | 22.2 |
TEMP | SEPT | OCT | NOV | DEC | JAN | FEB | MAR | APR | MAY | JUNE | JULY | AUG |
St 1 | 27.7 | 28.8 | 29.9 | 29.92 | 30.42 | 30.4 | 29.8 | 29.9 | 29.92 | 30.4 | 30.4 | 29.8 |
St 2 | 27.41 | 28.3 | 28.8 | 30.91 | 31.92 | 32.4 | 32.6 | 32.4 | 30.91 | 31.9 | 30.4 | 32.6 |
St 3 | 27.54 | 28.5 | 29.2 | 29.15 | 29.52 | 29.2 | 28.9 | 28.9 | 29.15 | 29.5 | 29.2 | 28.9 |
St 4 | 26.89 | 28.4 | 28.4 | 30.4 | 30.14 | 32.4 | 32.4 | 30.2 | 30.4 | 30.1 | 31.4 | 32.4 |
St 5 | 30.13 | 30.5 | 30.9 | 29.9 | 29.96 | 29.9 | 29.5 | 29.8 | 29.9 | 30 | 29.9 | 29.5 |
APPENDIX 2: Nutrient Parameter in Water
Phosphate | SEPT | OCT | NOV | DEC | JAN | FEB | MAR | APR | MAY | JUN | JUL | AUG |
St 1 | O.84 | 0.86 | 0.84 | 0.98 | 0.72 | 0.74 | 0.68 | 0.72 | 0.84 | 0.86 | 0.98 | 0.72 |
St 2 | 0.82 | 1 | 0.83 | 2 | 0.7 | 0.92 | 0.66 | 0.96 | 0.82 | 1 | 2 | 0.7 |
St 3 | 0.74 | 0.83 | 0.94 | 0.94 | 0.68 | 0.64 | 0.72 | 0.74 | 0.74 | 0.83 | 0.94 | 0.68 |
St 4 | 2.4 | 2.19 | 2.02 | 1.98 | 1.2 | 1.48 | 1.1 | 1.1 | 2.4 | 2.19 | 1.98 | 1.2 |
St 5 | 1.6 | 1.42 | 1.38 | 1.4 | 0.98 | 1.12 | 0.98 | 0.96 | 1.6 | 1.42 | 1.4 | 0.98 |
SULPHATE | SEPT | OCT | NOV | DEC | JAN | FEB | MAR | APR | MAY | JUN | JUL | AUG |
St 1 | 2.28 | 2.18 | 2.35 | 2.34 | 1.18 | 1 | 1.36 | 1.28 | 2.28 | 2.18 | 2.34 | 1.18 |
St 2 | 2.52 | 2.35 | 2.48 | 2.24 | 1.34 | 1.24 | 1.48 | 1.24 | 2.52 | 2.35 | 2.24 | 1.34 |
St 3 | 1.38 | 1.I9 | 1.4 | 1.56 | 1.16 | 1.09 | 1.1 | 1.3 | 1.38 | 1.19 | 1.56 | 1.16 |
St 4 | 2.36 | 2.26 | 2.16 | 2.28 | 1.26 | 1.4 | 1.26 | 1.42 | 2.36 | 2.26 | 2.28 | 1.26 |
St 5 | 2.24 | 1.46 | 2.32 | 2.42 | 1.22 | 1.26 | 1.3 | 1.44 | 2.24 | 1.46 | 2.42 | 1.22 |
NITRATE | SEPT | OCT | NOV | DEC | JAN | FEB | MAR | APR | MAY | JUNE | JUL | AUG |
St 1 | 0.62 | 0.61 | 0.68 | 1.16 | 0.62 | 0.62 | 0.65 | 0.78 | 0.62 | 0.61 | 1.16 | 0.62 |
St 2 | 0.65 | 0.65 | 0.99 | 1.25 | 0.62 | 0.66 | 0.74 | 0.68 | 0.65 | 0.65 | 1.25 | 0.62 |
St 3 | 0.63 | 0.98 | 0.63 | 1.25 | 0.62 | 1.12 | 0.96 | 0.94 | 0.63 | 0.98 | 1.25 | 0.62 |
St 4 | 0.98 | 0.65 | 0.66 | 1.25 | 1.14 | 1.02 | 0.98 | 0.86 | 0.98 | 0.65 | 1.25 | 1.14 |
St 5 | 0.97 | 0.85 | 0.98 | 1.32 | 1.24 | 0.96 | 0.88 | 0.9 | 0.97 | 0.85 | 1.32 | 1.24 |
APPENDIX 3: NUTRIENTS IN SEDIMENT
AVP | SEPT | OCT | NOV | DEC | JAN | FEB | MAR | APR | MAY | JUNE | JULY | AUG |
St 1 | 1.404 | 1.755 | 2.11 | 2.23 | 2.302 | 2.42 | 2.48 | 2.49 | 2.42 | 2.48 | 2.42 | 2.48 |
St 2 | 2.281 | 2.544 | 2.81 | 2.93 | 3.14 | 3.28 | 3.36 | 3.36 | 3.28 | 3.36 | 3.28 | 3.36 |
St 3 | 2.105 | 2.543 | 2.98 | 3.105 | 3.216 | 3.36 | 3.36 | 3.37 | 3.36 | 3.36 | 3.36 | 3.36 |
St 4 | 2.105 | 2.807 | 3.51 | 3.105 | 3.812 | 3.89 | 3.9 | 3.98 | 3.89 | 3.9 | 3.89 | 3.9 |
St 5 | 0.35 | 0.614 | 0.88 | 2.861 | 2.96 | 3.14 | 3.24 | 3.25 | 3.14 | 3.24 | 3.14 | 3.24 |
SULPHATE | SEPT | OCT | NOV | DEC | JAN | FEB | MAR | APR | MAY | JUN | JUL | AUG |
St 1 | 2.595 | 2.914 | 3.23 | 3.42 | 3.522 | 3.58 | 3.65 | 3.7 | 3.58 | 3.65 | 3.58 | 3.65 |
St 2 | 2.913 | 2.794 | 2.67 | 2.82 | 2.914 | 3.18 | 3.25 | 3.24 | 3.18 | 3.25 | 3.18 | 3.25 |
St 3 | 1.798 | 1.998 | 2.2 | 2.219 | 2.32 | 2.43 | 2.54 | 2.63 | 2.43 | 2.54 | 2.43 | 2.54 |
St 4 | 2.565 | 3.974 | 5.38 | 5.806 | 5.908 | 5.98 | 6.12 | 6.2 | 5.98 | 6.12 | 5.98 | 6.12 |
St 5 | 2.595 | 1.643 | 0.7 | 1.678 | 2.012 | 2.22 | 2.3 | 2.36 | 2.22 | 2.3 | 2.22 | 2.3 |
NITRATE | SEPT | OCT | NOV | DEC | JAN | FEB | MAR | APR | MAY | JUN | JUL | AUG |
St 1 | 0.833 | 0.829 | 0.83 | 1.625 | 1.836 | 1.96 | 1.98 | 2.11 | 1.96 | 1.98 | 1.96 | 1.98 |
St2 | 0.84 | 0.842 | 0.84 | 1.74 | 1.926 | 2.14 | 2.24 | 2.32 | 2.14 | 2.24 | 2.14 | 2.24 |
St3 | 0.838 | 1.147 | 1.47 | 2.48 | 3.54 | 3.62 | 3.62 | 3.64 | 3.62 | 3.62 | 3.62 | 3.62 |
St4 | 1.044 | 0.841 | 0.84 | 1.586 | 2.252 | 2.34 | 2.35 | 2.35 | 2.34 | 2.35 | 2.34 | 2.35 |
St5 | 1.044 | 0.954 | 0.86 | 1.824 | 2.548 | 2.58 | 2.61 | 2.65 | 2.58 | 2.61 | 2.58 | 2.61 |
APPENDIX 4: Seasonal Variation in Concentration of physicochemical parameters in water and sediment
PARAM | DRY SEASON | RAINY SEASON | ||||||||||||
WATER | OCT | NOV | DEC | JAN | FEB | MAR |
| APR | MAY | JUN | JUL | AUG | SEP |
|
Ph | 6.73 | 6.88 | 6.88 | 7.01 | 6.88 | 7.08 | 6.91* | 6.98 | 6.94 | 7 | 6.88 | 7.08 | 6.57 | 6.9 |
ORP | 134.8 | 111.8 | 116 | 117 | 118 | 117 | 119* | 114 | 113 | 116 | 119 | 97.2 | 116 | 112 |
DO | 5.03 | 4.57 | 4.91 | 4.98 | 4.76 | 4.72 | 5.79* | 4.44 | 4.48 | 4.58 | 4.76 | 4.72 | 5.5 | 4.75 |
BOD | 2.7 | 2.4 | 2.6 | 2.64 | 2.94 | 2.62 | 2.65 | 3.75 | 3,25 | 3.64 | 2.94 | 2.62 | 2.82 | 3.17* |
COND | 42.6 | 50.6 | 51.8 | 51.8 | 58 | 79.2 | 55.7 | 54.6 | 62 | 62 | 66 | 79.2 | 34.6 | 59.8* |
TDS | 21.1 | 25.4 | 24.6 | 27 | 23.8 | 22.6 | 24.1* | 16.3 | 16.6 | 17.4 | 21.8 | 24.6 | 17.4 | 19.0 |
SAL | 0.01 | 0.014 | 0.02 | 0.02 | 0.02 | 0,2 | 0.05* | 0.02 | 0.02 | 0.02 | 0.2 | 0.02 | 0.01 | 0.04 |
TURB | 30.3 | 25.7 | 27 | 22.8 | 24.9 | 22.1 | 25.5 | 20.2 | 23 | 25.8 | 24.9 | 20.6 | 34.9 | 29* |
TEMP | 28.9 | 29.4 | 30.1 | 30.4 | 30.9 | 30.6 | 30.0* | 30.2 | 30.1 | 30.4 | 30.3 | 30.3 | 27.9 | 29.8 |
AVP | 1.26 | 1.2 | 1.46 | 0.86 | 0.98 | 0.82 | 1.1 | 0.90 | 1.28 | 1.26 | 1.46 | 0.86 | 1.28 | 1.2* |
SO4 | 1.89 | 2.14 | 2.17 | 1.23 | 1.20 | 1.3 | 1.66 | 1.34 | 2.16 | 1.57 | 2.17 | 1.23 | 2.16 | 1.77* |
NO3 | 0.75 | 0.79 | 1.25 | 0.85 | 0.88 | 0.84 | 0.89 | 0.83 | 0.77 | 0.75 | 1.25 | 1,25 | 0.77 | 0.94* |
SED AVP | 2.05 | 2.46 | 2.85 | 3.09 | 3.21 | 3.26 | 3.0* | 3.29 | 3.22 | 3.27 | 3.22 | 3.27 | 1.65 | 2.99 |
SED SO4 | 2.67 | 2.84 | 3.18 | 3.34 | 3.48 | 3.57 | 3.18 | 3.63 | 3.48 | 3.72 | 3.48 | 3.77 | 2.49 | 3.4* |
SED NO3 | 0.92 | 0.97 | 1.35 | 2.42 | 2.53 | 2.55 | 1.87 | 2.6 | 253 | 2.09 | 2.53 | 2.56 | 0.92 | 2.21* |
*Higher concentration