Research Article | Volume :3 Issue 2 (July-Dec, 2022) | Pages 1 - 8
Farming Business Analysis and Marketing System of Chillian Chillies in Lakardowo Village, Jetis District, Mojokerto Regency
 ,
 ,
1
Master of Agribusiness Study Program, Faculty of Agriculture, UPN Veterans East Java, Jl. Rungkut Madya No. 1 Gunung Anyar, Gunung Anyar District, Surabaya East Java City, 60294, Indonesia
Under a Creative Commons license
Open Access
Received
July 15, 2022
Revised
July 20, 2022
Accepted
July 28, 2022
Published
Sept. 10, 2022
Abstract

The more cayenne pepper does not necessarily result in greater income, because the price of cayenne pepper affects revenue. Materials for consideration for farmers in making decisions to carry out cayenne pepper farming activities in addition to the technical aspects of how farmers allocate production factors to produce high production, the amount of production produced from the harvest, and also the economic aspect, namely the costs incurred by farmers to implement the activity. This study aims to analyze the factors that influence cayenne pepper farming and to analyze the total income of cayenne pepper farmers in Lakardowo Village, Jetis District, Mojokerto Regency. The research location was chosen purposively with a method of determining the location of the research which was determined deliberately based on the consideration that Lakardowo Village is a large chili producer center in the Mojokerto Regency area. The sample used in this research method is 43 farmers. The analysis in this study uses Partial Least Square (PLS) analysis and income analysis. The results of the study The factors that affect chili farming there is 1 factor that has a significant positive effect, namely Labor. While the 3 factors that do not have a significant effect are Land Area, Capital and Management Factors on chili farming. Factors - both factors that have no effect and influence must still be considered for increasing production and income of chili farming in Lakardowo Village, Jetis District, Mojokerto Regency. The marketing system has two forms of marketing channels for chili commodities in Lakardowo Village, Jetis District, Mojokerto Regency, from the two marketing channels seen from the value of marketing margins, farmer's share and marketing efficiency, marketing chain 2 provides a higher price share to farmers.

Keywords
Important Note

Key findings:

This study in Lakardowo Village, Mojokerto Regency, finds that while factors like labor significantly influence cayenne pepper farming, others like land area, capital, and management have no significant effect. Marketing channels also impact farmers differently, with chain 2 offering higher price shares. These factors should be considered to boost production and income.


What is known and what is new?

This study contributes by analyzing factors influencing cayenne pepper farming and income in Lakardowo Village, Mojokerto Regency. It finds labor significantly affects farming, while land area, capital, and management do not. Additionally, it highlights marketing channel differences, with chain 2 providing higher price shares. These insights provide valuable guidance for improving chili farming strategies and income in the area.


What is the implication, and what should change now?

The implication of this study is that farmers in Lakardowo Village should focus on optimizing labor allocation to improve cayenne pepper farming income. Additionally, they should consider the marketing channel that offers higher price shares, such as chain 2, to maximize their revenue. Changes in farming practices and marketing strategies based on these findings could lead to increased profitability for chili farmers in the area.

INTRODUCTION

Indonesia is an agricultural country, where the agricultural sector has a large contribution to Gross Domestic Product (GDP). The agricultural sector consists of the agricultural sub-sectors of food crops and horticulture, plantations, livestock, marine and land fisheries, and forestry. One of the horticultural commodities that have high economic value in Indonesia is big red chili and cayenne pepper. These large red chili and cayenne pepper plants grow well in the highlands and lowlands, especially at the time of flowering they are not resistant to rain, because the flowers will fall easily, and are susceptible to damage due to extreme climate change [1].


East Java is the province with the largest cayenne pepper production in Indonesia, reaching 578.88 thousand tons in 2021. This amount contributes 41.75 percent to the national cayenne pepper production. Meanwhile, Central Java was in second place, contributing 12.93 percent with production reaching 179.29 thousand tons. Meanwhile, West Java contributed 9.91% with production reaching 137.46 thousand tons.


Lakardowo Village, Jetis District, Mojokerto Regency, East Java Province is one of the villages in Mojokerto Regency which is a center for producing cayenne pepper. Almost all farmers in Lakardowo Village plant cayenne pepper every year as an agricultural commodity that is relied upon as their main income.


Towards the end of the year until the beginning of the year, chili prices soared quite high reaching more than Rp. 100,000/kg, while at certain times the price could fall below Rp. 10,000/kg. This seasonal price fluctuation occurs almost every year and unsettles the chili consumer community. The spike in chili prices was caused by reduced supply, while demand was constant and continuous every day, even increasing in certain seasons. Farid and Subekti [2], stated that chili price fluctuations occur because chili production is seasonal, rain factors, production costs, and the length of distribution channels.


Until now there has been no concrete solution from the government to control the spike in chili prices, except to monitor prices and imports of chilies from abroad. Chili in the last October 2021 period jumped very sharply. The increase in chili imports was recorded at 1.774%. Chili imports in October 2021 were recorded at 44,591,583 kilograms (kg). This number increased by 1.774% compared to October 2020 which was only 2,378,576 kg. Compared to the previous month, chili imports also rose 887.46% from 4,515,794 kg in September 2021. Meanwhile, the value of chili imports in October 2021 was recorded at US$ 5,359,072. This value increased by 15.89% compared to October 2020.


Efforts to reduce the spike in chili prices are to continue to provide an adequate supply of chili in the market by planting chilies throughout the season, including during the rainy season. Farmers are usually reluctant to plant chilies in the rainy season because the risk of crop failure is quite high.


The production of more cayenne pepper does not necessarily result in greater income, because the price of cayenne pepper affects revenue. The selling price of cayenne pepper at the farmer level is still low, causing the income received by farmers is also low. Materials for consideration for farmers in making decisions to carry out cayenne pepper farming activities in addition to the technical aspects of how farmers allocate production factors to produce high production, the amount of production produced from the harvest, and also the economic aspect, namely the costs incurred by farmers to carry out the activity. Because even though production has increased but cannot be marketed, it will be futile efforts to increase production [3].


It is known that agricultural products from farmers, especially horticultural commodities, are easily damaged or cannot last long. Therefore, planting planning and the process of delivering harvests from farmers (producers) to markets (consumers) must be considered. Apart from being a meeting place for traders and buyers for transactions, markets are important for agricultural products. The purpose of building a market is to provide a place or means for producers to deliver their products to consumers through marketing agencies, so that the market is the final consumer and or organizational consumer, namely consumers who have tangible needs and desires as a demand for the product.


This study aims to analyze the factors that influence cayenne pepper farming and the income of cayenne pepper farmers in Lakardowo Village, Jetis District, Mojokerto Regency.

RESEARCH METHODS:

The research location was chosen purposively with a method of determining the location of the research which was determined deliberately based on the consideration that Lakardowo Village, Jetis District, Mojokerto Regency is a center for producing large cayenne pepper commodities in the Mojokerto Regency area and has been cultivated for quite a long time. In addition, almost all farmers cultivate chili during the chili planting season. The population in this study were farmers and traders in Lakardowo Village, Jetis District, Mojokerto Regency, the highest production of cayenne pepper was the total population of 1085 farmers. According to Sugiyono (Sugiyono, P. D. 2009) [4] the sample is part of the number and characteristics possessed by the population. Purposive sampling method was carried out to select cayenne pepper farmers who would be used as respondents' sources. Determination of the number of samples is carried out using the Slovin formula as follows:

N

n = -------------------

1 + Ne2

Information:

n       = Number of Samples

N       = Total Population

e        = Error Tolerance Limit (error tolerance) 15% (0.15)

So:

1085

n = ------------------- = 42.7

1 + 1085(0,15)2


Based on the above calculations, the researchers determined that the sample members used in this research method were 43 farmers.


To analyze the factors that influence the cayenne pepper farming. By making a questionnaire where the results of filling out the questionnaire will be analyzed by grouping based on variables and scoring with a Likert scale. The data analysis technique in this study used Partial Least Square (PLS). PLS is a Structural Equation Modeling (SEM) equation model with an approach based on variance or component-based structural equation modeling. According to Ghozali & Latan (Ghozali, I., & Latan, H. 2015) [5], the purpose of PLS-SEM is to develop a theory or build a theory (prediction orientation). PLS is used to explain whether there is a relationship between latent variables (prediction). PLS is a powerful analytical method because it does not assume current data with a certain scale measurement, the number of samples is small [5]. PLS-SEM analysis consists of two sub-models, namely the measurement model or the outer model and the structural model or the inner model.


The marketing channel of cayenne pepper is observed starting from chili farmers by calculating the percentage supply of cayenne pepper from farmers to the final consumer. The marketing channel will describe the marketing channel map. The analysis of the marketing channel of cayenne pepper in Lakardowo Village, Jetis District, Mojokerto Regency is carried out by identifying the marketing institutions that make up the marketing channel. Marketing institutions play a role in the process of distributing cayenne pepper from farmers to final consumers.


Marketing margin is the difference between the price received by farmers and the price paid by consumers. To analyze the price data marketing used is the price at the farmer level (producer) and the price at the consumer level, can be systematically formulated as follows:

Mpi= Pri – Pfi

Mpi = Bi + Ki

Ki = Mpi - Bi

Information:

Mpi  = Red Chili Marketing Margin (Rp/Kg)

Pri    = selling price of red chili at the trader level (Rp/Kg)

Pfi     = Red chili selling price at farmer level (Rp/Kg)

Bi      = Total costs incurred by marketing agencies (B1, B2, B3Bn)

Ki      = Total profit affected by marketing agency (K1, K2, K3,…Bn)

So that:


To calculate the farmer's share or the share received by the producer, the formula according to Soekartawi (2005) [6] is used as follows:

Fs     = Share received by farmers (%)

Pfi     = Price received at farmer level (Rp/Kg)

Pri    = Price received at the merchant level (Rp/Kg)

To     calculate marketing efficiency (Ep), in general, the formula according to Soekartawi (Soekartawi. 2005) [6] can be used, namely:

Information:

EP     = Marketing efficiency (%)

TBP  = Total marketing costs (Rp/Kg)

TNP  = Total production value, namely: Purchase price to the final consumer (Rp/Kg)


The lower the ratio of the total cost to the total value of the product, the more efficient the marketing system and the higher the ratio of the total cost to the total value of the product, the marketing system is inefficient.
RESULTS AND DISCUSSION:
  • Factors Affecting Chili Farming:

Data analysis in this study examines the effect of several independent variables on the dependent variable and the mediating variable. Hypothesis testing was carried out using the Partial Least Square (PLS) method. Partial Least Square is a structural Equation Modeling (SEM) solution method. The research entitled the performance of the Alsintan brigade in analyzing research data using SEM analysis with the WarpPLS 5.0 application. The steps in analyzing the data are as follows:

  • Outer Model:

Data testing was conducted to determine how much influence the independent variables had on chili farming for testing the data as follows:

  • Convergent Validity:

Convergent validity of the measurement model with reflexive indicators can be seen from the correlation between item scores/indicators and construct scores. Individual reflective measure is said to be high if it has a correlation of more than 0.70 with the construct to be measured.


Table 1: Average Variance External

Variable

AVE . value

Land Area (X )

0.954

Capital (X )

0.898

Labor (X )

0.943

Management Factor (X )

0.894

Chili Farming (Y)

0.856  _

Source: primary data analysis, 2022


The minimum value to declare that reliability has been achieved is 0.50. The results of the AVE test in this study were X1 to X4 valued at 0.894 to 0.954 and Y was worth 0.856, the AVE value had exceeded 0.05. So that it meets the standard of the AVE value, namely the average extract variant with a value > 0.5 is used as a determinant of convergent validity. So if < 0.5 then it is not convergently valid. Table 1:


  • Discriminant Validity:

Discriminant validity indicators can be seen in the cross loading between the indicators and their constructs. Variables with low loading values indicate that the indicator does not have a good effect on reflective indicators > 0.7, while the formative variables of each variable provide the largest contribution to the construct. Variables with low loading values indicate that the indicator does not have a good effect on reflective indicators > 0.7, while the formative variables of each variable provide the largest contribution to chili farming. In this study, the correlation value of the variable with the indicator is greater than the correlation value with other constructs. Thus, all constructs or latent variables already have good discriminant validity, where indicators in the performance indicator block are better than indicators in other blocks.


  • Composite Reliability and Cronbach's Alpha:

Table 2: Composite Reliability and Cronbach's Alpha

Variable

Cronbach's Alpha

rho_A

Composite Reliability

Land Area (X )

0.9 84

0.984

0.988  _

Capital (X )

0.977  _

0.979  _

0.981  _

Labor (X )

0.970  _

0.973  _

0.980  _

Management Factor (X )

0.9 41

0.945

0.962  _

Chili Farming (Y)

0.916  _

0.919  _

0.947  _

Source: primary data analysis, 2022


A construct is declared reliable if it has a composite reliability value above 0.70 and Cronbach's alpha above 0.60. From the results of the SmartPLS output above, all constructs have a composite reliability value above 0.70 and Cronbach's alpha above 0.60. So it can be concluded that the construct has good reliability.


  • Analysis of Variant (R2):

Analysis of Variance (R2) Determination Test, namely to determine the influence of the independent variable on the dependent variable, the value of the coefficient of determination can be shown in the following table. Table 3:


Table 3: R-Square . Test Results

Information

R Square

R Square Adjusted

Chili Farming

0.804  _

0.783  _

Source: primary data analysis, 2022


From the model, the coefficient of determination (R2) is 0.804. This shows that 80.4% of the variations in chili farming variables can be explained by the variables of land area, capital, labor and management factors, while the remaining. 6% is explained by other variables not included in the model.


  • F-Square Uji Test:

The F-Square test is to find out the goodness of the model. The results of the F test can be seen in the following table. Table 4:

Table 4: F-Square . Test Results

Information

F – Square

Land Area (X )

0.118  _

Capital (X )

0.051  _

Labor (X )

0.893  _

Management Factor (X )

0.0 77

Source: primary data analysis, 2022

Based on the results of the calculations for the variables of capital, land area and management factors have a value of 0.051; 0.118 and 0.077 this value is greater than 0.02 then it is declared weak. While the value of the labor variable is 0.893, which is greater than 0.35, then the labor variable is stated to be large at the structural level.


  • Measurement Model:

Measurement Model is part of SmartPls 3 which specifies indicators (observed variables) for each construct variable, and calculates the reliability value for the construct, or a model that explains the operationalization of research variables into measurable indicators expressed in the form of path diagrams and or certain mathematical equations [7].


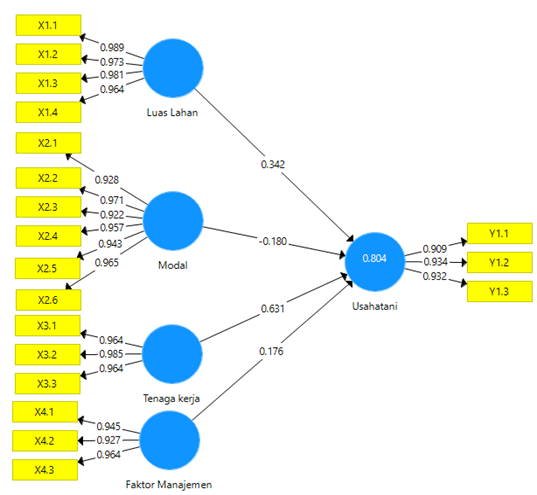
Figure 1: Results of the Structural Model of Factors Affecting Chili Farming


To assess the significance of the prediction model in testing the structural model, it can be seen from the path coefficient and p values between the independent variables to the dependent variable in the Path Coefficient table at the SmartPLS 3 output below:Table 5


Table 5: Path Coefficient and P Values

Variable

Original Sample (O)

Sample Mean (M)

Standard Deviation (STDEV)

T Statistics (IO/STDEVI)

P Values

X 1  → Y

0.342 _

0.325 _

0.195  _

1.752

0.080  _

X 2  → Y

-0. 180

-0. 153

0.1 48

1.212

0.226  _

X 3  → Y

0.631 _

0.622 _

0.122  _

5.188

0.000

X 4  → Y

0.176 _

0.1 78

0.091  _

1.936

0.053  _

Source: primary data analysis, 2022

Based on the results of data analysis, where the path coefficient value of land area (X1) shows the beta coefficient of land area to farming is 0.342 and the t-statistic is 1.752. From this result, it is stated that the t-statistic is significant, because it is >1.681 from the t-table but the p-value is >0.05 so the second hypothesis is rejected. This proves that the area of land is not proven to have a positive effect on farming. This means that the area of land for chili farming is less noticed by chili farmers. This is because the condition of the land area has less effect on the production of agricultural products, including chili, both in terms of area, fertility level and its use such as dry land, paddy fields, gardens and so on. This is because almost all respondents who are chili farmers do not rent land so it does not affect the cost.


Based on the results of data analysis, where the path coefficient of Capital (X2) shows the beta coefficient of Capital to Farming is -0.180 and the t-statistic is 1.212. From these results, it is stated that the t-statistic is not significant, because <1.681 of the t-table with p-value <0.05 so the second hypothesis is rejected. This proves that capital is not proven to have a positive influence on farming. Capital in this case the costs incurred in fixed costs and variable costs during chili farming. In the research area the use of seeds is still minimal and made by farmers themselves have not thought about the use of superior seeds so that the results are still far from expectations. Inorganic fertilizer capital continuously will cause a strong residue to be bound by soil particles and a lack of organic matter in the soil can cause fertilizers to be easily carried away by water due to flooding or abundant water and in the dry season it will cause drought so that there is not enough fertilizer available for plant roots [8]. Pesticides used by respondent farmers are herbicides, fungicides and insecticides. As for the land and equipment capital, it is not always purchased every year only according to the needs of farmers and spends large capital at the beginning of chili farming activities.


Based on the results of data analysis, the influence of the independent variable labor (X3) on the dependent variable of chili farming (Y) shows the value of the beta coefficient of capital on farming is 0.631 and the t-statistic is 5.188. From these results, it is stated that the t-statistic is significant, because >1.681 of the t-table with p-value <0.05 so that the third hypothesis is accepted. This proves that the workforce is proven to have a positive influence on farming. In this case, the workforce pays attention to several important things such as age, education and farming experience. Most of the respondent farmers are not young, so it takes a long time to adopt new knowledge. Farmers' decisions are very decisive in the use of production inputs, including in the application of certified superior seeds as well as in the application of balanced fertilizers.


Based on the results of data analysis, where the path coefficient value of Management Factor (X4) on the dependent variable of chili farming (Y) shows the beta coefficient value of Management Factor on Farming is 0.176 and the t-statistic is 1.936. From these results, it is stated that the t-statistic is significant, because it is >1.681 from the t-table but the p-value is >0.05 so the fourth hypothesis is rejected. This proves that the Management Factor has no positive effect on farming. Good management factors are able to increase success in farming, because in its implementation it is well planned in the field of agricultural machinery technology development, labor management and improving the quality of human resources and can even minimize failure by carrying out risk management. But in this research area less attention is paid to management factors. So that not a few farmers who experience losses when harvesting chili.


Of the factors that affect chili farming, there is one factor that has a significant positive effect, namely labor. While the 3 factors that do not have a significant effect are Land Area, Capital and Management Factors on chili farming. These factors, both unaffected and influential, must be considered for increasing production and income of chili farming in Lakardowo Village, Jetis District, Mojokerto Regency.


  • Marketing System Analysis:

The marketing system for chili commodity products in Lakardowo Village, Jetis District, Mojokerto Regency is often said to be a weak part in the marketing chain, this is due to the nature of the product that is easily damaged or rotten, so the marketing of these products is still relatively low. Therefore, there is a need for further processing so that it can be processed into products that can survive with long enough storage so that the possibility or need for opportunities for marketing will continue.


  • Marketing Agency:

The red chili marketing system in Lakardowo Village, Jetis District, Mojokerto Regency cannot be separated from the role of marketing institutions that take part in marketing activities. Marketing institutions consist of farmers, wholesalers, agents, distributors, retailers and consumers. Each marketing agency has an important role in chili marketing.


  • Marketing Function:

The chili marketing process in Lakardowo Village, Jetis District, Mojokerto Regency has a channel that is passed in the marketing process of chili production in Lakardowo Village, Jetis District, Mojokerto Regency, until it finally reaches the final consumer. The marketing functions involved include:


The function of sales is to find potential buyers of the products offered in the hope of being profitable. Selling is the opposite of buying. Buying will not happen without selling and vice versa. From this study, farmers sell their chilies to collectors because collectors are always ready to buy the farmers' crops, in contrast to retailers who only come directly to farmers if the price of chili in the market is high. directly to the market in large quantities.


The purchase function is the transfer of red chilies from farmers, wholesalers to retailers and then to consumers through transactions. Wholesalers buy chilies from farmers. Here the exchange function of wholesalers occurs, namely the purchase of chilies to chili farmers. Wholesalers can get chili by subscribing or visiting red chili farmers directly.


The function of transportation is the transfer of chili from the farmer to the place of sale where the chili is. In terms of marketing chili farmers do not interfere, but only carried out by wholesalers using transportation facilities in the form of a pick-up car / L 300. The transportation function is carried out by wholesalers.


The function of capital, in this case, farmers and traders use their own capital. Collector traders in doing business as chili traders use their own cars.


The risk use function occurs when the chili is not sold or is damaged or the chili condition is damaged. Based on the results of observations, the risk-taking occurs to wholesalers if the chili is wet which results in a decrease in the selling price.


The market information function is carried out by wholesalers, this is done to find out what the price of chili is and the demand for the number of chilies by consumers. Usually traders obtain information about the market from fellow traders and some also get information from listening to news from both print and electronic media about market conditions, the amount of demand and prices for agricultural commodities in the market as well as the supply of goods from outside the region.


The function of standardization and grading, all chili farmers do not standardize and grade their chili production. However, standardization and grading are carried out by wholesalers, standardization and grading are carried out by separating wet, bad, small and large chilies.


  • Marketing Channel:

Marketing channels can be chosen freely, meaning they can determine which marketing channels are the most profitable and the most achievable for their production. The following is the chili marketing channel scheme in Lakardowo Village, Jetis District, Mojokerto Regency. Fig 1


Figure 1: Chili Marketing Channels in Lakardowo Village, Jetis District, Mojokerto Regency


Figure 1. shows that there are two marketing channels for chili from Lakardowo Village, Jetis District, Mojokerto Regency, farmers sell their products to collectors / wholesalers from Lakardowo Village, Jetis District, then collectors sell chilies to agents or distributors then to retailers in markets that in Mojokerto Regency. For the second peeling channel, farmers sell to chili collectors and then from collectors to retailers sell to final consumers, namely the people in Mojokerto Regency.

  • Marketing Margin:

Marketing margin analysis is used to determine the value of the selling price margin of chili at each marketing agency in Lakardowo Village, Jetis District, Mojokerto Regency. In addition, this analysis also wants to know the benefits and costs incurred by each marketing agency. Marketing margin is calculated by subtracting the selling price of chilies from the purchase price of the chilies. In marketing chili, each marketing channel requires various costs, while these costs include: transportation costs, loading and unloading costs, packing costs and labor costs.


Table 6: Chili Marketing Analysis in Lakardowo Village, Jetis District, Mojokerto Regency

Marketing Channel I

No.

Description

Unit

Score

1

Farmer


Total cost

Rp/Kg

22.893


Selling price

Rp/Kg

35,000

2

Collecting Merchant


Total cost

Rp/Kg

3,643


Selling price

Rp/Kg

40,000


Marketing Margin

Rp/Kg

5,000

3

Agent or Distributor


Total cost

Rp/Kg

1,000


Selling price

Rp/Kg

42,000


Marketing Margin

Rp/Kg

2,000

4

Retailer


Total cost

Rp/Kg

1,230


Selling price

Rp/Kg

45,000


Marketing Margin

Rp/Kg

3,000


Total Margin


10,000

Marketing Channel II

1

Farmer


Total cost

Rp/Kg

22.893


Selling price

Rp/Kg

35,000

2

Collecting Merchant


Total cost

Rp/Kg

1,215


Selling price

Rp/Kg

38.000


Marketing Margin

Rp/Kg

3,000

3

Retailer


Total cost

Rp/Kg

1,230


Selling price

Rp/Kg

40,000


Marketing Margin

Rp/Kg

2,000


Total Margin


5,000

Data analyzed, 2022


In table 6. for marketing channel I, it can be seen that farmers sell their harvests to village collectors at an average price of IDR 35,000/kg. Village collectors sell chilies to agents or distributors with an average price of IDR 40,000.00/kg, the marketing margin obtained is IDR 5,000/kg while the marketing costs incurred are IDR 3,643/kg. The profit margin ratio (RPM) obtained by village collectors is 1.37. This means that for every Rp. 100,- which is issued by village collectors, it will provide a profit of Rp. 137,-. Agents or distributors sell chilies to retailers, the profit margin ratio (RPM) obtained by agents or distributors is 2. This means that every Rp 100, - issued by wholesalers will provide a profit of Rp 200, -. The profit margin ratio (RPM) obtained by retailers is 2.43. This means that every Rp 100, - issued by a wholesaler will provide a profit of Rp 243, -. Marketing channel II can be seen that farmers sell their harvests to village collectors at an average price of IDR 35,000/kg. Wholesalers or village collectors sell chilies to retailers at an average price of Rp. 38,000/kg, the marketing margin obtained is Rp. 3,000/kg while the marketing costs incurred are Rp. 1,215/kg. The profit margin ratio (RPM) obtained by wholesalers is 2.5. This means that every Rp 100, - issued by a wholesaler will provide a profit of Rp 250, -.


  • Farmer's Share:

Farmer's share shows the share of value that farmers get from marketing activities. The value paid by the consumer is not fully received by the farmer because of the marketing margin which reduces the share of the value received by the farmer.


Table 7: Farmer's Share Analysis on Chili Farming Marketing Channels

Marketing channel

Farmer Level Price (Rp/Kg)

Prices at Retailers (Rp/Kg)

Farmer's Share (%)

I

35,000

45,000

77.78

II

35,000

40,000

87.5

Source: Data analyzed, 2022

The highest farmer's share channel is 87.5 percent, namely sales from farmers to wholesalers directly to retailers. Farmer's share has a negative relationship with marketing margin, the larger the farmer's share, the bigger the share received by farmers. The share received by farmers is positive, which means that chili farmers in Lakardowo Village, Jetis District, Mojokerto Regency benefit because they are directly sold to collectors and then to retailers where the location of wholesalers and retailers is near the farmer's house. Table 7:


  • Marketing Efficiency:

To facilitate the flow of goods from producers to consumers, one of the influencing factors is choosing the right and efficient channel. The marketing system will be efficient if it meets 2 requirements, namely being able to convey the results of production from producers to consumers at the lowest cost. The results showed that the chili marketing channel was not efficient in the first channel, namely the efficiency of 16.78, in the second channel the chili marketing was efficient, which was 7.08.

CONCLUSION

Alsintan Brigade in Sidoarjo Regency that has been carried out, it can be concluded that there is 1 factor that affects chili farming, namely the workforce. While the 3 factors that do not have a significant effect are Land Area, Capital and Management Factors on chili farming. These factors, both unaffected and influential, must be considered for increasing production and income of chili farming in Lakardowo Village, Jetis District, Mojokerto Regency. The marketing system has two forms of marketing channels for chili commodities in Lakardowo Village, Jetis District, Mojokerto Regency, namely:

  • marketing chain 1: farmers - village collectors - agents or distributors - retailers - consumers;

  • marketing chain 2: farmers – village collectors – retailers – consumers.


From the two marketing channels, it can be seen from the value of marketing margin, farmer's share and marketing efficiency, marketing chain 2 gives the farmer a higher share of the price.

Conflict of Interest

The authors declare that they have no conflict of interest.

Funding:

No funding sources 

Ethical approval:

The study was approved by the Institutional Ethics Committee of UPN Veterans East Java

References
  1. Nofita, Indira, and Syamsul Hadi. "Analisis produktivitas usahatani cabai merah besar (Capsicum annum l.) di desa Andongsari kecamatan ambulu kabupaten Jember." JSEP (Journal of Social and Agricultural Economics) 8.3 (2016): 66-71. https://jurnal.unej.ac.id/index.php/JSEP/article/view/3761

  2. Farid, Miftah, and Nugroho Ari Subekti. "Tinjauan terhadap produksi, konsumsi, distribusi dan dinamika harga cabe di Indonesia." Buletin Ilmiah Litbang Perdagangan 6.2 (2012): 211-234. DOI: https://doi.org/10.30908/bilp.v6i2.132

  3. Ningsih, Kustiawati. "Analisis Saluran dan Marjin Pemasaran Petani Jambu Air Camplong (Syzygium aqueum)." AGROMIX 3.1 (2012). DOI: https://doi.org/10.35891/agx.v3i1.746

  4. Sugiyono, P. D. (2009). Metode Penelitian Kuantitatif Kualitatif dan R&D, Bandung: CV. ALVABETA.

  5. Ghozali, Imam, and Hengky Latan. "Konsep, teknik, aplikasi menggunakan Smart PLS 3.0 untuk penelitian empiris." BP Undip. Semarang 290 (2015).  

  6. Soekartawi. (2005). Agroindustri Dalam Perspektif Sosial Ekonomi. Raja Grafindo Persada. Jakarta.

  7. Gunarto, Muji. MODEL CO-CREATION DAN IMPLIKASINYA TERHADAP LOYALITAS MAHASISWA PADA PERGURUAN TINGGI SWASTA: Studi pada PTS di Provinsi Sumatera Selatan. Diss. Universitas Pendidikan Indonesia, 2018. URL: http://repository.upi.edu

  8. Hardjowigeno, S. (2007). Ilmu tanah [Soil science]. Jakarta, ID: Akademika Pressindo.

Advertisement
Recommended Articles
Research Article
Study of Marination of Broiler Chicken with Garlic on Water Holding City, Cooking Loss, Tenderness and Number of Bacteria
...
Published: 20/06/2025
Download PDF
Research Article
Mating behaviour of Cavariella aegopodii
Published: 19/07/2024
Download PDF
Research Article
The Effect of Marination Duration using Tamarind Paste (Tamarindus indica L.) on pH, Tenderness, Water-holding Capacity and Cooking Loss of Spent Layer Meat
...
Published: 30/06/2024
Download PDF
Research Article
The Role of Indigenous Microbes and Earthworm in the Bioconversion of Dairy Wastewater Solids into Organic Fertilizer
...
Published: 17/01/2024
Download PDF
Chat on WhatsApp
Flowbite Logo
Najmal Complex,
Opposite Farwaniya,
Kuwait.
Email: kuwait@iarcon.org

Editorial Office:
J.L Bhavan, Near Radison Blu Hotel,
Jalukbari, Guwahati-India
Useful Links
Order Hard Copy
Privacy policy
Terms and Conditions
Refund Policy
Others
About Us
Contact Us
Online Payments
Join as Editor
Join as Reviewer
Subscribe to our Newsletter
Follow us
MOST SEARCHED KEYWORDS
scientific journal
 | 
business journal
 | 
medical journals
 | 
Scientific Journals
 | 
Academic Publisher
 | 
Peer-reviewed Journals
 | 
Open Access Journals
 | 
Impact Factor
 | 
Indexing Services
 | 
Journal Citation Reports
 | 
Publication Process
 | 
Impact factor of journals
 | 
Finding reputable journals for publication
 | 
Submitting a manuscript for publication
 | 
Copyright and licensing of published papers
 | 
Writing an abstract for a research paper
 | 
Manuscript formatting guidelines
 | 
Promoting published research
 | 
Publication in high-impact journals
Copyright © iARCON Internaltional LLP . All Rights Reserved.