The Effect of Drive-Thru Service Quality and Product Quality on Customer Satisfaction Jokopi Merr Surabaya
Aulia Audina Iresanti
1
,
Eko Priyanto
1
,
Sigit Dwi Nugroho
1
1
Department of Agribusiness, Faculty of Agriculture, University of National Development "Veteran" National Development University "Veteran" East Java, Yogyakarta 55283, Indonesia
This study aims to determine the effect of service quality and product quality on consumer satisfaction of Jokopi Merr Surabaya shop. The number of samples in this study was 50 respondents who were over 17 years old and had purchased through the Jokopi Merr drive-thru service. Data collection is carried out by distributing questionnaires to respondents. The data analysis method in this study uses Structural Equation Modeling-Partial Least Square (SEM-PLS) with WarpPLS version 7 application. The results showed that service quality and product quality had a positive and significant effect on consumer satisfaction.
Keywords
Service quality
Product quality
Customer satisfaction
SEM-PLS
Important Note
Key findings:
The study found that both service quality and product quality positively and significantly affect consumer satisfaction at Jokopi Merr Surabaya. This indicates that improvements in these areas are likely to enhance customer satisfaction, emphasizing the importance of maintaining high standards in both service and product offerings.
What is known and what is new?
Service quality and product quality are established factors that influence consumer satisfaction in the retail and service industries. This study specifically examines these factors within the context of Jokopi Merr Surabaya, revealing that both service quality and product quality significantly enhance consumer satisfaction in a drive-thru coffee shop setting, thus providing targeted insights for this specific business model.
What is the implication, and what should change now?
Ensuring high service quality and product quality is crucial for enhancing consumer satisfaction at Jokopi Merr Surabaya. Jokopi Merr should focus on consistently improving service standards and product offerings. Implementing regular staff training, quality control measures, and customer feedback mechanisms can help maintain and elevate these standards, ultimately boosting customer satisfaction and loyalty.
INTRODUCTION
The development of the culinary business in Indonesia is experiencing rapid progress; this can be seen from the increasing number of new cafes and restaurants. The performance of the food and beverage industry in Indonesia during the 2015-2019 period grew above the average of other industries [1]. The development of the culinary business can be caused because food and beverages are the primary needs of humans in addition to the current consumption patterns of more consumptive people.
The culinary business that is currently stretched almost all over the world, especially in Indonesia, is the coffee shop business because coffee drinks have become a lifestyle for almost some people, this is supported by data on coffee consumption in Indonesia from 2014-2021 which always increases every year so that business people are competing to establish a coffee shop. Based on the results of research by PT Toffin with MIX MarComm SWA Group magazine, it is stated that the number of coffee shops in Indonesia in August 2019 reached more than 2,950 outlets, this number only includes chain outlets in big cities [2]. Surabaya is ranked the second largest city in Indonesia after Jakarta with a population of 2.87 million people [3]. The city of Surabaya is certainly also a contributor to the increasing consumption of coffee in Indonesia. This can be seen from the increasing number of coffee shops in Surabaya that are established close to each other. For example, along Jalan Merr or Jalan Ir.H. Sukarno. Some of these coffee shops are Jokopi Merr, Belikopi, Tuku Coffee Shop, Starbucks, Excelso, and others.
Coffee shops that are increasingly rampant certainly cause business competition to be very tight so a business must have characteristics that are different from its competitors and always make innovations that aim to attract consumers. Jokopi Merr is the only coffee shop in Surabaya that innovates drive thru or lantatur services (service without going down). Jokopi made a product innovation in the form of blusukan milk iced coffee which was used as ice cream in a cup under the name es grem.
Innovation in a business that is adjusted to the latest situations and conditions is an important thing to do to create consumer satisfaction so that the company can survive in increasingly fierce business competition. After the company innovates, the next is how the company can maintain or even improve its quality so that consumers feel satisfied. Factors that can encourage customer satisfaction include service quality and product quality.
service quality is a form of consumer assessment of the level of service received with the expected level of service [4]. Service quality can be said to be satisfactory if the perceived service is equal to or exceeds the quality of service expected by consumers [5]. While product quality is the suitability of the product to the needs of the consumer market, companies must understand what consumers need for a product to be produced and the ability of a product to demonstrate its function [6]. The quality of a product can have an important role in the company because it can have a symbol of trust that is valuable in the eyes of consumers [7].
Good service quality and product quality as well as achieving consumer satisfaction will have an impact on increasing visitors and sales. According to google review, Jokopi Merr shop is get 4.5 stars out of 5. The number 4.5 means that the average rating given by consumers to Jokopi Merr is quite good but there is still a one-star rating. Kedai Jokopi Merr experienced a decrease in the number of transactions in 2022 compared to the previous year.
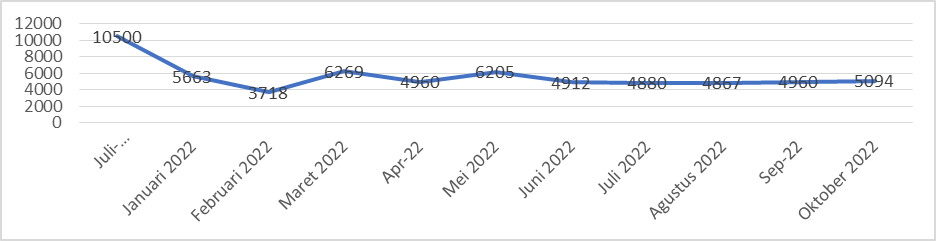
Figure 1. Number of Transactions at Jokopi Merr Shop
Source: PT Jokopi Indonesia Group (2022)
Based on the data in the picture above, it shows that the average number of transactions for Jokopi Merr shops in 2022 compared to 2021 has decreased by 50%, so it can be said that Jokopi Merr shops lost some consumers due to not achieving consumer satisfaction.
The quality of drive thru service and the quality of products provided by the shop are expected to bring consumer satisfaction to the Jokopi Merr shop. Consumers who are satisfied with the quality of service and product quality provided by a company are likely to repurchase intention, positive word of mouth, and recommend a product or service. Therefore, satisfaction is an aspect that needs to be considered by Jokopi Merr shop. This study aims to analyze the effect of drive thru service quality and product quality on consumer satisfaction in Jokopi Merr Surabaya shop.
RESEARCH METHODS
This research was conducted at Kedai Jokopi Merr Jl. Dr. Ir. H. Soekarno No.431, Penjaringan Sari, Rungkut District, Surabaya City, East Java. The sample in this study is as many as 50 respondents because according to Ned Kock, the minimum number of samples to be analyzed using WarpPLS software is 50 sample [8]. The sampling technique in this study uses a non-probability sampling method, namely purposive sampling (sample consideration) which is a random sample selection technique obtained using certain considerations, namely at least 17 years old and have purchased through the drive thru service of Jokopi Merr shop at least once.
In this study, the type of data used is primary data obtained from interviews, observations, questionnaire and secondary data obtained from previous research journal data, literature books, and internal and external company data. This study uses several independent variables (X), namely service quality and food quality. While the dependent variable (Y) in this study is customer satisfaction. Variable indicators of research on variable service quality used include physical evidence (X1.1), reliability (X1.2), responsiveness (X1.3), assurance (X1.4), and empathy (X1.5). Research variable indicators on product quality variables used include innovation (X2.1), presentation (X2.2), taste (X2.3), aroma (X2.4), and packaging (X2.5). Research variable indicators on consumer satisfaction variables used include consumer satisfaction surveys (Y1.1) and recommendations (Y1.2).
Data analysis in this study uses SEM (Stuctural Equation Modeling) analysis with PLS (Partial Least Square) approach to analyze the effect of drive thru service quality and product quality on consumer satisfaction of Jokopi Merr Surabaya shop. This study used WarpPLS data processing software version 7. To analyze, several tests using Partial Least Square (PLS) are used, namely the evaluation of measurement models (outer model) and evaluation of structural models (inner model). Evaluation of the measurement model (outer model) consisting of validity tests and reliability tests. While structural evaluation (inner model) includes R-square for coefficients of determination and path coefficients to test hypotheses.
RESULTS AND DISCUSSION
Characteristics of Jokopi Merr Consumers
Tabel 1 Characteristics of Jokopi Merr Consumers
Gender
Amount
Percentage
Man
18
36%
Woman
32
64%
Total
50
100%
Age
Amount
Percentage
17 - 25 years
37
74%
26 - 35 years
6
12%
36 - 45 years
4
8%
46 - 55 years
3
6%
Total
50
100%
Work
Amount
Percentage
Student / Student
30
60%
Businessman
2
4%
Government employees
4
8%
Private employees
11
22%
Other
3
6%
Total
50
100%
Income
Number of people
Percentage
< IDR 2,000,000
31
62%
IDR 2,000,000 – IDR 3,500,000
4
8%
IDR 3,500,000 – IDR 4,500,000
7
14%
> IDR 4,500,000
8
16%
Total
50
100%
Source: Primary data processed (2023)
Based on the table above, it can be concluded that the majority of consumers are women as many as 32 people or 64%. Consumers aged 17 to 25 years were 37 people or 74%. The average customers works as a student or university student as many as 30 people with a percentage of 60% and the majority of customers have an income of < IDR 2,000,000 as many as 31 people with a percentage of 62%. Tabel 1
Evaluation of the Measurement Model (Outer Model)
Convergent Validity
In reflective constructs, there are two criteria to assess whether the outer model (measurement model) meets the convergent validity requirements, namely the outer loading value must be above 0.7. In addition to outer loading values, convergent validity can also be assessed through AVE (average variance extracted. The recommended AVE value is above 0.5. Tabel 2
Table 2. Outer Loading and AVE Values
Variable
Indicator Items
Outer Loading
Average Variance Extracted (AVE)
Consumer satisfaction
(Y1)
Y1.1.P1
0.935
0.872
Y1.1.P2
0.929
Y1.2.P1
0.963
Y1.2.P2
0.908
Source: Primary data processed (2023)
Based on the convergent validity test in Table 4.9, it is known that all values > 0.7 which means that they have met the validity requirements based on the outer loading value, so it can be said that the consumer satisfaction variable (Y1) can be reflected in the four indicator items. In table 4.9, it is known that the AVE value is 0.872 which means > 0.5, meaning that the value has met the validity requirements based on AVE.
Significant of Weight &; Variance Inflation Factor
The outer model with formative indicators is evaluated based on the significance of weight and multicollinearity which can be seen in the variance inflation factor (VIF) value.
Table3. Evaluation of Formative Constructs
Variable
Indicator Items
Outer Loading
VIF
Service Quality (X1)
X1.1.P1
0.829
2.788
X1.1.P2
0.782
2.466
X1.2.P1
0.833
2.845
X1.2.P2
0.836
3.059
X1.3.P1
0.828
2.879
X1.3.P2
0.864
3.264
X1.4.P1
0.866
3.667
X1.4.P2
0.852
3.416
X1.5.P1
0.829
3.067
X1.5.P2
0.874
4.012
Product Quality (X2)
X2.1.P1
0.776
2.337
X2.1.P2
0.802
2.519
X2.2.P1
0.761
2.623
X2.2.P2
0.859
3.235
X2.3.P1
0.845
3.25
X2.3.P2
0.842
3.115
X2.4.P1
0.875
3.605
X2.4.P2
0.848
3.084
X2.5.P1
0.772
2.656
X2.5.P2
0.805
2.659
Source: Primary data processed (2023)
Based on testing the validity of outer loading in table 4.12, all outer loading values >0.5, which means that each indicator is able to explain its latent variables. All VIF values <5 which means they are valid, This is in accordance with Nedkock's opinion that the recommended VIF is lower than 5 [9].
Discriminant Validity
In discriminant validity testing, the AVE square root value of a latent variable is compared with the correlation value between that latent variable and other latent variables.
Table 4. Output Latent Variable Correlation
X1
X2
Y
X1
0.84
X2
0.624
0.840.819
Y
0.77
0.687
0.840.934
Source: Primary data processed (2023)
Based on the table above, it is known that the square root value of AVE for each latent variable is greater than the correlation value between the latent variable and other latent variables. So it is concluded that it has met the requirements for discriminant validity.
Composite Reliability
Construct reliability testing can be measured through two criteria, namely composite reliability and cronbach alpha. A construct can be declared reliable if it has a composite reliability value and Cronbach alpha greater than 0.70.
Table 5. Output Cronbach's Alpha and Composite Reliability
Variable
Cronbach's Alpha
Composite Reliability (CR)
Cutomer Satisfaction
0.951
0.965
Source: Primary data processed (2023)
Based on table 4.11 it can be seen that the value of composite reliability is 0.965 and the value of cronbach alpha is 0.951 which means > 0.7. This means that all question items used to measure each variable are reliable. Tabel 5
Structural Model Evaluation (Inner Model)
Model Fit Test
In the model fit test, there are 3 test indices, namely average path coefficient (APC), Average R-Squared
(ARS), and Average Variance Factor (AVIF). APC and ARS are accepted on condition that the p-value < 0.05 and AVIF is less than 5.
Tabel 6. Output Goodness of Fit
Keterangan
Value
Criteria
Average Path Coefficient (APC)
0.450
< 0,05
Average R-squared (ARS)
0.674
< 0,05
Average Blok VIF (AVIF)
1.705
Acceptable if ≤ 5
Source: Primary data processed (2023)
Based on the table above, It is known that the APC value is 0.450, with a P-Value < 0.001, which means < 0.05, meaning that the model fit test is fulfilled. While ARS has a value of 0.674, with a P-Value value of < 0.001, which means < 0.05, meaning that the model fit test has been fitted. The AVIF value is 1.705 ≤ 5, which means the model fit testing has been fitted.’ Tabel 6
R-Squared
Analysis of the coefficient of determination aims to determine the magnitude of the influence of the independent variable on the dependent variable, the value of the coefficient of determination can be shown in Table 7.
Tabel 7. Output R-Square (R2)
Customer Satisfaction (Y)
R Square
0.67
Source: Primary data processed (2023)
Based on table 4.14 above, it can be seen that the value of R-Square = 0.67, which means Service Quality (X1) and Product Quality (X2) can explain Consumer Satisfaction (Y) by 67% and the rest is influenced by other variables outside this study by 33%. Tabel 7
Hypothesis Testing
Subsequent testing is intended to prove the correctness of research allegations or hypotheses. The results of the correlation between variables are measured by looking at path coefficients and their level of significance. The significance level used in this study was 5%
Tabel 8. Hypothesis Testing Results
Hypothesis
Path Coefficient
P-Values
Service Quality Customer Satisfaction (H1)
0.559
<0.001
Product Quality Customer Satisfaction (H2)
0.341
0.004
Source: Primary data processed (2023)
The hypotheses proposed in this study are all acceptable because each of the influences shown has a P-Values value of < 0.05 and positive path coefficient values show unidirectional (positive) influences between variables. So it can be stated that exogenous variables to endogenous variables have a positive and significant influence. In addition, it is known that the exogenous variable of service quality has a path coefficient value of 0.559, this value is higher than the exogenous variable of product quality, which is 0.341. So the effect of the drive thru service quality variable on the satisfaction variable is higher. Tabel 8
DISCUSSION
The Effect of Service Quality on Customer Satisfaction
Based on the results of the hypothesis test in table 8, a P-Values value of <0.001 was obtained on the service quality variable (X1) from the test results, it can be known that there is a significant influence between service quality variables (X1) on customer satisfaction (Y1), then the H1 hypothesis is accepted. This is because the p-value is in accordance with the criterion, namely the hypothesis is accepted if the p-value is <0.05. From the results of this test, a path coefficient value of 0.559 was also obtained, which means that service quality (X1) has a positive influence on customer satisfaction (Y1) or it can be said that 55.9% of customer satisfaction is determined by service quality. Thus, the H1 hypothesis in this study is accepted, namely that service quality has a positive and significant influence on Jokopi Merr Surabaya customer satisfaction.
The Effect of Product Quality on Consumer Satisfaction
Based on the results of the hypothesis test in table 8, a P-Values value of 0.004 was obtained on the product quality variable (X2) from the test results, it can be known that there is a significant influence between product quality variables (X2) on consumer satisfaction (Y1), and then the H2 hypothesis is accepted. This is because the p-value is in accordance with the criterion, namely the hypothesis is accepted if the p-value is <0.05. From the results of this test, a path coefficient value of 0.341 was also obtained, which means that product quality (X1) has a positive influence on consumer satisfaction (Y1) or it can be said that 34.2% of consumer satisfaction is determined by product quality. Thus, the H2 hypothesis in this study is accepted, namely that product quality has a positive and significant influence on consumer satisfaction of Jokopi Merr Surabaya.
Recommendations for strategies to increase customer satisfaction related to drive thru service quality and product quality
Based on Fig. 1, the number of transactions of Kedai Jokopi Merr has decreased in 2022 compared to 2021. This can be because consumers have not felt very satisfied with several indicators of service quality and product quality that affect consumer satisfaction so the Jokopi Merr Surabaya shop needs to improve service quality and product quality. According to consumer ratings on google review Jokopi Merr Surabaya shop, there are still some problems that need to be fixed. One of the consumers who gave a bad assessment on google review about the Jokopi Merr Surabaya shop was Edward Tedjobuwono, he gave the following statement:
“sistem pelayanan lemot banget, menunggu satu jam untuk drive thru yang harusnya konsepnya cepat. Sangat kecewa, not recommended dari kepingin minum sampai ga kepingin karena lamanya”
Jokopi Merr shop drive thru only has one counter to place orders as well as payment, this is different from the drive thru in general in Surabaya which has a minimum of two counters. Based on information from store manager Jokopi Merr Surabaya, the cashier ordered drive thru so combined with dine-in ordering and online ordering. If at the same time, consumers are ordering through the drive thru, dine in, and online counters, it will cause queues that are quite time-consuming and service becomes ineffective.
Recommended strategies that can be done by Jokopi Merr Surabaya shop to improve the quality of drive thru service are by adding a special cash register for payment at the drive thru counter and if possible for Jokopi Merr shop to separate the drive thru counter to place orders and payment with the drive thru counter to pick up products.
Bad ratings of products contained in the Jokopi Merr shop are also given by consumers on google reviews, one of which is like a statement written by Handoro, which is as follows:
“Pilihan menu sedikit, lumayan murah tapi tidak ada makanan beratnya”
One of the recommended strategies that can be done by Jokopi Merr Surabaya shop is to innovate products or create new products aimed at meeting the needs and desires of consumers. For example, such as adding heavy food menus, especially rice menus because according to research conducted by Licorice: Southeast Asian Markets Insights as many as 88.4 percent of respondents namely Indonesian people prefer rice over other staple foods such as noodles and bread [10].
Consumer satisfaction will have a good impact on the company such as the development of the company and an increase in sales which will later refer to the progress and smooth running of the Jokopi Merr Surabaya shop business.
CONCLUSION
Based on the results of data analysis and hypothesis testing that have been done, the conclusions in this study are:
Consumer Characteristics of Jokopi Merr Surabaya shop are more female with a percentage of 64% and the average age of consumers is 17 -25 years with a percentage of 74% which is dominated by students or students with a percentage of 60% and an income level of < Rp. 2,000,000 with a percentage of 62%.
Drive thru service quality (X1) has a positive and significant effect on customer satisfaction (Y1). This shows that building good drive thru service quality will affect customer satisfaction.
Product quality (X2) has a positive and significant effect on consumer satisfaction (Y1). This shows that making good product quality will affect consumer satisfaction.
Recommendations for strategies to increase consumer satisfaction drive thru Jokopi Merr shop can be done by improving service quality, especially in the responsiveness indicator (X1.3), and maintaining quality in the empathy indicator (X1.5) as well as improving product quality, especially in the innovative indicator (X2.1) and maintaining quality in the aroma indicator (X2.4).
Conflict of Interest:
The authors declare that they have no conflict of interest.
Funding:
No funding sources
Ethical approval:
The study was approved by the Institutional Ethics Committee of "Veteran" National Development University
Surabaya, Badan Pusat Statistik Kota. "Hasil Sensus Penduduk 2020 Kota Surabaya." Surabayakota. Bps. Go. Id (2021).
Kotler, Philip, and Kevin Lane Keller. "Manajemen Pemasaran, PT." Prenhallindo, Jakarta (2000).
Sa’adah, Lailatus. Kualitas layanan, harga, citra merk serta pengaruhnya terhadap kepuasan konsumen. LPPM Universitas KH. A. Wahab Hasbullah, 2020.
Kotler, Philip, and Gary Armstrong. Principles of marketing. Pearson education, 2010.
Nastiti, Heni. "Analisis pengendalian kualitas produk dengan metode statistical quality control (Studi kasus: pada PT “X” Depok)." Proceeding of International Conference Sustainable Competitive Advantage. Vol. 4. No. 1. 2014. http://www.jp.feb.unsoed.ac.id/index.php/sca-1/article/view/688
Kock, Ned. "WarpPLS user manual: Version 6.0." ScriptWarp Systems: Laredo, TX, USA 141 (2017): 47-60.
Kock, Ned. "Advanced mediating effects tests, multi-group analyses, and measurement model assessments in PLS-based SEM." International Journal of e-Collaboration (ijec) 10.1 (2014): 1-13.https://www.igi-global.com/article/advanced-mediating-effects-tests-multi-group-analyses-and-measurement-model-assessments-in-pls-based-sem/105472
Putri, V. K. M. (2021, March 14). Kenapa Orang Indonesia Suka Makan Nasi? Kompas.Com. https://www.kompas.com/skola/read/2021/03/14/091522869/kenapa-orang-indonesia-suka-makan-nasi?page=all
Advertisement
Recommended Articles
Research Article
Study of Marination of Broiler Chicken with Garlic on Water Holding City, Cooking Loss, Tenderness and Number of Bacteria
Lilis Suryaningsih,
...
Dicki Tri Utama
Published: 20/06/2025
Download PDF
Cite
x
APA
Suryaningsih, L., Gumilar, J., Setyadi Putranto, W., Wulandari, E., None, P. & Tri Utama, D. (2025). Study of Marination of Broiler Chicken with Garlic on Water Holding City, Cooking Loss, Tenderness and Number of Bacteria. Himalayan Journal of Agriculture, 6(1), 1-4.
MLA
Suryaningsih, Lilis, et al. "Study of Marination of Broiler Chicken with Garlic on Water Holding City, Cooking Loss, Tenderness and Number of Bacteria." Himalayan Journal of Agriculture 6.1 (2025): 1-4.
Chicago
Suryaningsih, Lilis, Jajang Gumilar, Wendry Setyadi Putranto, Eka Wulandari, Pratama and Dicki Tri Utama. "Study of Marination of Broiler Chicken with Garlic on Water Holding City, Cooking Loss, Tenderness and Number of Bacteria." Himalayan Journal of Agriculture 6, no. 1 (2025): 1-4.
Harvard
Suryaningsih, L., Gumilar, J., Setyadi Putranto, W., Wulandari, E., None, P. and Tri Utama, D. (2025) 'Study of Marination of Broiler Chicken with Garlic on Water Holding City, Cooking Loss, Tenderness and Number of Bacteria' Himalayan Journal of Agriculture 6(1), pp. 1-4.
Vancouver
Suryaningsih L, Gumilar J, Setyadi Putranto W, Wulandari E, Pratama P, Tri Utama D. Study of Marination of Broiler Chicken with Garlic on Water Holding City, Cooking Loss, Tenderness and Number of Bacteria. Himalayan Journal of Agriculture. 2025 Jan;6(1):1-4.
Download PDF
Research Article
Mating behaviour of Cavariella aegopodii
Nidhi Dhatwalia
Published: 19/07/2024
Download PDF
Cite
x
APA
Dhatwalia, N. (2024). Mating behaviour of Cavariella aegopodii. Himalayan Journal of Agriculture, 5(1), 1-7.
MLA
Dhatwalia, Nidhi. "Mating behaviour of Cavariella aegopodii." Himalayan Journal of Agriculture 5.1 (2024): 1-7.
Chicago
Dhatwalia, Nidhi. "Mating behaviour of Cavariella aegopodii." Himalayan Journal of Agriculture 5, no. 1 (2024): 1-7.
Harvard
Dhatwalia, N. (2024) 'Mating behaviour of Cavariella aegopodii' Himalayan Journal of Agriculture 5(1), pp. 1-7.
Vancouver
Dhatwalia N. Mating behaviour of Cavariella aegopodii. Himalayan Journal of Agriculture. 2024 Jan;5(1):1-7.
Download PDF
Research Article
The Effect of Marination Duration using Tamarind Paste (Tamarindus indica L.) on pH, Tenderness, Water-holding Capacity and Cooking Loss of Spent Layer Meat
Dina Ayu Wulandari,
...
Dicky Tri Utama
Published: 30/06/2024
Download PDF
Cite
x
APA
Wulandari, D. A., Suryaningsih, L. & Utama, D. T. (2024). The Effect of Marination Duration using Tamarind Paste (Tamarindus indica L.) on pH, Tenderness, Water-holding Capacity and Cooking Loss of Spent Layer Meat. Himalayan Journal of Agriculture, 5(1), 1-12.
MLA
Wulandari, Dina A., Lilis Suryaningsih and Dicky T. Utama. "The Effect of Marination Duration using Tamarind Paste (Tamarindus indica L.) on pH, Tenderness, Water-holding Capacity and Cooking Loss of Spent Layer Meat." Himalayan Journal of Agriculture 5.1 (2024): 1-12.
Chicago
Wulandari, Dina A., Lilis Suryaningsih and Dicky T. Utama. "The Effect of Marination Duration using Tamarind Paste (Tamarindus indica L.) on pH, Tenderness, Water-holding Capacity and Cooking Loss of Spent Layer Meat." Himalayan Journal of Agriculture 5, no. 1 (2024): 1-12.
Harvard
Wulandari, D. A., Suryaningsih, L. and Utama, D. T. (2024) 'The Effect of Marination Duration using Tamarind Paste (Tamarindus indica L.) on pH, Tenderness, Water-holding Capacity and Cooking Loss of Spent Layer Meat' Himalayan Journal of Agriculture 5(1), pp. 1-12.
Vancouver
Wulandari DA, Suryaningsih L, Utama DT. The Effect of Marination Duration using Tamarind Paste (Tamarindus indica L.) on pH, Tenderness, Water-holding Capacity and Cooking Loss of Spent Layer Meat. Himalayan Journal of Agriculture. 2024 Jan;5(1):1-12.
Download PDF
Research Article
The Role of Indigenous Microbes and Earthworm in the Bioconversion of Dairy Wastewater Solids into Organic Fertilizer
Marlina ,
...
N. Meynadhea
Published: 17/01/2024
Download PDF
Cite
x
APA
None, M., Rahayu, N. A., Badruzzaman, D. Z., Hidayati, Y., Harlia, E., Kurniawan, E. & Meynadhea, N. (2024). The Role of Indigenous Microbes and Earthworm in the Bioconversion of Dairy Wastewater Solids into Organic Fertilizer. Himalayan Journal of Agriculture, 5(1), 1-7.
MLA
None, Marlina, et al. "The Role of Indigenous Microbes and Earthworm in the Bioconversion of Dairy Wastewater Solids into Organic Fertilizer." Himalayan Journal of Agriculture 5.1 (2024): 1-7.
Chicago
None, Marlina, N. A. Rahayu, D. Z. Badruzzaman, Y.A. Hidayati, E. Harlia, E. Kurniawan and N. Meynadhea. "The Role of Indigenous Microbes and Earthworm in the Bioconversion of Dairy Wastewater Solids into Organic Fertilizer." Himalayan Journal of Agriculture 5, no. 1 (2024): 1-7.
Harvard
None, M., Rahayu, N. A., Badruzzaman, D. Z., Hidayati, Y., Harlia, E., Kurniawan, E. and Meynadhea, N. (2024) 'The Role of Indigenous Microbes and Earthworm in the Bioconversion of Dairy Wastewater Solids into Organic Fertilizer' Himalayan Journal of Agriculture 5(1), pp. 1-7.
Vancouver
Marlina M, Rahayu NA, Badruzzaman DZ, Hidayati Y, Harlia E, Kurniawan E, Meynadhea N. The Role of Indigenous Microbes and Earthworm in the Bioconversion of Dairy Wastewater Solids into Organic Fertilizer. Himalayan Journal of Agriculture. 2024 Jan;5(1):1-7.
Iresanti, A. A., Priyanto, E. & Nugroho, S. D. (2023). The Effect of Drive-Thru Service Quality and Product Quality on Customer Satisfaction Jokopi Merr Surabaya. Himalayan Journal of Agriculture, 4(1), 1-6.
MLA
Iresanti, Aulia A., Eko Priyanto and Sigit D. Nugroho. "The Effect of Drive-Thru Service Quality and Product Quality on Customer Satisfaction Jokopi Merr Surabaya." Himalayan Journal of Agriculture 4.1 (2023): 1-6.
Chicago
Iresanti, Aulia A., Eko Priyanto and Sigit D. Nugroho. "The Effect of Drive-Thru Service Quality and Product Quality on Customer Satisfaction Jokopi Merr Surabaya." Himalayan Journal of Agriculture 4, no. 1 (2023): 1-6.
Harvard
Iresanti, A. A., Priyanto, E. and Nugroho, S. D. (2023) 'The Effect of Drive-Thru Service Quality and Product Quality on Customer Satisfaction Jokopi Merr Surabaya' Himalayan Journal of Agriculture 4(1), pp. 1-6.
Vancouver
Iresanti AA, Priyanto E, Nugroho SD. The Effect of Drive-Thru Service Quality and Product Quality on Customer Satisfaction Jokopi Merr Surabaya. Himalayan Journal of Agriculture. 2023 Jan;4(1):1-6.