This research aims to optimize digital customer service to enhance customer satisfaction at PT. Bank Jaya Bersama. In the context of ongoing digitalization, banks must align their services with customer expectations. The methods used include in-depth case studies with data collection through customer surveys based on Service Quality (SERVQUAL) theory and analysis of internal documents, especially in the Contact Center division. Data analysis uses the Importance Performance Analysis (IPA) method and the examination of ticket data and post-contact surveys to explore customer perceptions and experiences. The research results indicate that quick response, quality communication and accurate information are key factors in improving customer satisfaction with digital services. Challenges in integrating these factors into the bank's service model and strategies to overcome these challenges are also examined. The conclusion of this research affirms that integrating quick response, quality communication and accurate information provision into digital services is essential for enhancing customer satisfaction. The implication is that banks must prioritize adjusting their digital service strategies to the evolving needs and expectations of customers. This will form the basis for an effective future digital customer engagement strategy and strengthen the bank's competitive position in the digital era.
Keywords
Digital Customer Service
Customer Satisfaction
Contact Center
Service Quality
INTRODUCTION
Background
In this digital era, banks must balance the use of the latest technology with customer satisfaction through responsive and empathetic services. Effectiveness in handling complaints and requests is key to customer satisfaction in the banking sector. Recurring complaints indicate a complaint management system that is not yet optimal and can damage customer trust.
Responding to complaints quickly and accurately is crucial. Customers who feel their issues are taken seriously will be more satisfied and loyal. However, customer satisfaction depends not only on technology but also on the bank's responsiveness to their needs.
Digital transformation should involve a human approach, integrating technology with empathy and quick responses in customer service. Customer satisfaction has a broader relevance, shifting from just being a cost center to a profit center, as explained in SWA Magazine. This underscores the importance of customer satisfaction, especially in digital banking.
Business Issue
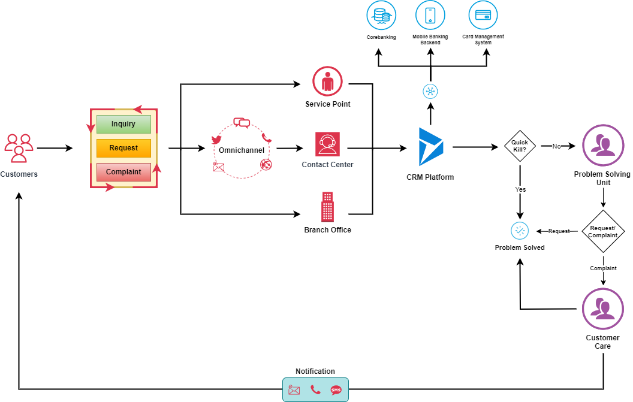
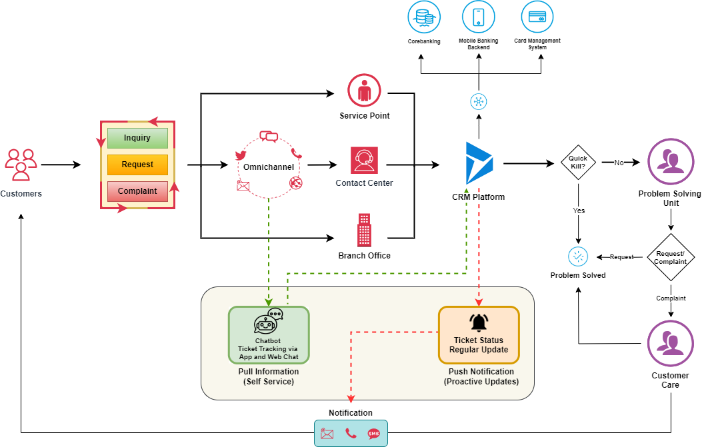
The current process for receiving customer requests and complaints at the Contact Center involves a structured workflow aimed at providing efficient and effective solutions to customer queries and issues. This process is depicted in the Contact Center ticket flow diagram, which shows three general categories of customers: Inquiries, Requests and Complaints. Inquiries are usually resolved instantly without requiring special handling. Requests involve banking data or transaction requests that may require special handling by the Problem-Solving Unit (PSU) and could trigger customers to call back if not promptly addressed. Complaints relate to customer expectations not being met regarding their data or transactions, often requiring follow-up contact as they cannot be immediately resolved, especially if involving financial losses.
Customers can contact the Bank Jaya Bersama Contact Center through three accesses: Service Point, Contact Center Agent and Branch Office. Service Point is a Contact Center provided by the bank in shopping centre to bring services closer to customers. The Contact Center Agent is the main access point with 24-hour services through various communication channels, but customers need to go through a verification process. At the Branch Office, customers can directly submit inquiries, requests, or complaints and data verification is done manually by the Customer Service officers.
Figure 1: Process Flow for Ticket Reception at the Contact Center
All tickets entered are recorded in the CRM application of Bank Jaya Bersama, which is the main application in Contact Center service and is integrated with various other applications like Core Banking and Mobile Banking Backend Service. When a ticket is submitted and cannot be resolved immediately, it will be escalated to the PSU team or Customer Care team, requiring analysis and resolution time during bank operational hours, which might lead to customers calling back.
Operational challenges and scalability of the Contact Center, especially during peak activities or promotions, can cause repeated customer contacts. Delays in handling requests or difficult verification processes can decrease customer satisfaction. Furthermore, the long resolution time for complaints, as well as the need for repeated contact, can contribute to dissatisfaction and affect long-term customer retention. Addressing these challenges requires not only resolving operational and technological issues but also emphasizing problem resolution on the first contact to minimize repeated customer contacts and enhance overall satisfaction. An illustration of the issue can be seen in Figure 1.
Research Objectives
The objective of this research is to first understand the current level of customer satisfaction at PT. Bank Jaya Bersama. This study will identify the factors contributing to repeated customer contacts for the same issues. It will employ an Importance-Performance Analysis (IPA) approach combined with Comparative Analysis of CRM ticket data. The aim is to develop effective strategies to reduce repeated requests and complaints. This approach is expected to enhance customer satisfaction and improve the operational efficiency of the Contact Center.
MATERIALS AND METHODS
The methodology used in this research is quantitative methodology.
Customer Questionnaire
In this research, the author distributed a questionnaire to customers. This questionnaire was designed using the SERVQUAL method [1], which includes 22 questions divided into five dimensions of the method. Respondents are asked to fill out this questionnaire using a 5-point Likert scale. The main purpose is to explore customer preferences related to the Contact Center services at PT. Jaya Bersama bank. Table 1 shows the questionnaire distributed to the customers.
Reliability and Validity Test
After collecting the questionnaire results, the author proceeded with conducting reliability and validity tests [2]. A total of 37 customers participated in filling out the questionnaire.
Table 1: Questionnaire for Customers (Author, 2023)
Category
No
Statement
Tangibles
1
The technological tools (e.g., Phone/Email/Chat/DM) used and provided by the Contact Center support quick and effective problem resolution.
2
The Contact Center has a ticket tracking system that is easy for customers to view their status.
3
I always receive documentation proof or a reference every time I contact the Contact Center.
4
Contact Center agents have adequate access to view my ticket history and interactions.
Reliability
1
The responses from the Contact Center are always in line with what they previously promised.
2
The Contact Center makes an effort to understand the root of the problem to prevent me from having to contact them repeatedly.
3
Contact Center agents always provide clear information about the process of handling my ticket.
4
I always receive a response or solution from the Contact Center within the promised time frame.
5
The information I receive from the Contact Center is consistent, even when I communicate with different agents.
Responsiveness
1
The Contact Center is always easy to reach through various channels (Chat/Email/Phone, etc.).
2
Contact Center agents are always ready and quick to respond when I inquire about the progress of my ticket.
3
The Contact Center is quick and consistent in providing solutions to the problems I experience.
4
The Contact Center system provides automatic notifications about the progress of the ticket I reported.
Assurance
1
I feel that my personal information and ticket history are secure when interacting with the Contact Center.
2
When I make repeated contacts, Contact Center agents communicate politely and provide assurance of resolution.
3
The Contact Center has a mechanism that ensures my ticket is handled by an agent with relevant expertise.
4
I feel confident that my ticket will be resolved after contacting the Contact Center.
Empathy
1
Contact Center agents seem to understand my frustration when I contact them about the same issue.
2
I feel valued as a customer, even though I have to contact them repeatedly.
3
Contact Center agents provide solutions that take into account my needs and conditions.
4
When I make repeat contacts, the Contact Center always recognizes my previous communication history.
5
The operating hours of the Contact Center make it easy for me to contact them according to my needs and convenience.
Table 2: Reliability Test Result
Cronbach”s Alpha
Number of Item
Status
Expectation
0.995
22
Pass
Perception
0.983
22
Pass
Table 3: Customer Expectations Validity Test
Item
Correlation Value
Validity
TG1_EX
0.931
Valid
TG2_EX
0.909
Valid
TG3_EX
0.883
Valid
TG4_EX
0.912
Valid
RL1_EX
0.904
Valid
RL2_EX
0.904
Valid
RL3_EX
0.921
Valid
RL4_EX
0.930
Valid
RL5_EX
0.949
Valid
RE1_EX
0.944
Valid
RE2_EX
0.968
Valid
RE3_EX
0.969
Valid
RE4_EX
0.938
Valid
AS1_EX
0.954
Valid
AS2_EX
0.954
Valid
AS3_EX
0.954
Valid
AS4_EX
0.959
Valid
EM1_EX
0.964
Valid
EM2_EX
0.977
Valid
EM3_EX
0.977
Valid
EM4_EX
0.958
Valid
EM5_EX
0.967
Valid
The reliability and validity tests were run separately on the Perception and Expectation sections of the customers. This is crucial to ensure that the data collected are accurate and reliable for further research. The Reliability and Validity Test in this study is carried out using SPSS software.
Reliability Test
Table 2 shows the results of the reliability test for the perception and expectations of customers.
The Expectations section recorded a very high Cronbach's Alpha value of 0.995andPerception obtained a value of 0.983. Based on the Cronbach's Alpha Consistency Table, these values place the instrument in the "Excellent" reliability category, affirming its strength and dependability for the purposes of this research.
Validity Test
Here are the results of the validity test for customerperception and expectations.
The table displays the correlation level for each question about expectations in the questionnaire, indicating how closely each question is related to the total score of all questions on expectations, as an indicator of internal consistency. With 37 respondents, the significance level for a two-tailed test with p < .05 is 0.2746, based on degrees of freedom (df = N-2). This table shows that the correlation (R Count) for each item exceeds the minimum threshold, indicating that each expectation question in the questionnaire is statistically valid.
Table 4: Customer Perception Validity Test
Item
Correlation Value
Validity
TG1_PE
0.820
Valid
TG2_PE
0.808
Valid
TG3_PE
0.712
Valid
TG4_PE
0.817
Valid
RL1_PE
0.843
Valid
RL2_PE
0.792
Valid
RL3_PE
0.878
Valid
RL4_PE
0.889
Valid
RL5_PE
0.886
Valid
RE1_PE
0.789
Valid
RE2_PE
0.862
Valid
RE3_PE
0.903
Valid
RE4_PE
0.863
Valid
AS1_PE
0.758
Valid
AS2_PE
0.845
Valid
AS3_PE
0.876
Valid
AS4_PE
0.909
Valid
EM1_PE
0.906
Valid
EM2_PE
0.866
Valid
EM3_PE
0.915
Valid
EM4_PE
0.891
Valid
EM5_PE
0.787
Valid
Furthermore, Table 4 presents the results of the validity test for the Perception as perceived by customers.
This table shows the validity test results for Perception Items, similar to the previous results for Expectation Items already discussed. The table lists the correlation level for each Perception Item, reflecting the extent to which each item correlates with the aggregate score of all other items. This correlation, also known as R Count, measures the suitability of an item with the main construct being measured.
Like the Expectation Items, the R Count of each item in the Perception Items is compared with the critical R Table value to determine its validity. The R Table represents the critical value that the R Count must exceed to be considered valid at the significance level of p < .05, considering the number of respondents and degrees of freedom (df = N-2).
Since the R Count for each Perception Item exceeds the critical R Table value, each item is declared valid, following the pattern observed in the Expectation Items results. The consistency in validity across all items in both Expectation and Perception categories reinforces the overall reliability and validity of the questionnaire.
Therefore, both the Expectation and Perception values from the questionnaire have demonstrated high levels of reliability and validity, making it a powerful tool for analyzing data in this study.
Customer Satisfaction Index
The Customer Satisfaction Index (CSI) is a method used to determine the overall level of user satisfaction. It is achieved by assessing the importance of various attributes of each product and/or service. Essentially, CSI is a practical tool for measuring overall user satisfaction, taking into account the importance of the size of each attribute. The process of calculating CSI in this study involves a series of predetermined steps outlined below:
Step 1: Calculate the Mean of Importance Score (MIS) of each attribute
(1)
Where:
n = total of respondents
Yi = the expectation value of i-th attribute
Step 2: Calculate the Mean Satisfaction Score (MSS) of each attribute using equation
(2)
Where:
n = total of respondents
Xi = the expectation value of i-th attribute
Step 3: Calculate Weight Factors (WF) per attribute. Furthermore, this WF is a MIS percentage value each attribute to the total MIS of all attributes
(3)
Where:
MISi = The average value of importance to-i
∑MISi = Total average importance from i to p
Step 4: Calculate the Weight Score (WSi) for each attribute. WSi is a multiplication between WFi and MSSi, so that
(4)
Where:
i = the i-th attribute
Step 5: Calculate the Customer Satisfaction Index using equation
(5)
Where:
= maximum scale (5)
Importance Performance Analysis
After conducting the survey, the author also performed an analysis of the required performance level using the Importance Performance Analysis (IPA) theory [3]. This theory is a widely recognized tool for assessing customer satisfaction and service quality. The analysis helps organizations identify areas where they excel and those that need improvement, thereby facilitating strategic decision-making. IPA works by mapping the importance and performance of various aspects of a service or product on a two-dimensional grid, creating a visual representation of customer perceptions and expectations.
The IPA grid is divided into four quadrants:
High Importance-Low Performance (Focus Here): These are areas that require significant attention. They are highly valued by customers but currently underperform, indicating a need for immediate improvement.
High Importance-High Performance (Maintain Good Work): Attributes in this quadrant perform well and are very important to customers. They represent the strengths of the service or product.
Low Importance-Low Performance (Low Priority): These aspects are less critical and currently have low performance. While they may need attention, they are not as immediately required as those in the "Focus Here" quadrant.
Low Importance-High Performance (Possible Overkill): Attributes in this quadrant perform well but are not particularly important to customers. Resources allocated here might be better utilized in more critical areas.
Post-Contact Survey
This research also collected data from a Post-Contact Survey sent to customers after their tickets were resolved. The survey data used are from August 2023 to October 2023. This survey provides valuable direct feedback from customers regarding their satisfaction level with the services provided by the Contact Center team. The data obtained from the Post-Contact Survey Report complement the questionnaire data, offering additional perspectives on the overall experience at the Contact Center.
Repetitive Ticket Categories in CRM
This research also analyzed data to identify the most frequent categories of "Repeated Contact" tickets. The data analyzed were collected from August to October 2023. This source of data comes from the CRM application, which is used as a basis for recording all customer tickets. Repetition of tickets in the same category indicates that the solutions provided initially might not be effective, or that customers are experiencing difficulties in certain aspects of the product or service.
Ticket Volume in CRM Application and Main Case Categories
This research will also gather data on the Total Tickets in the CRM Application. This data will not only focus on the overall volume of contact center tickets but will also provide details on the main case categories, such as inquiries, requests and complaints. This analysis will enable the identification of the most frequent types of customer interactions within the CRM system.
By analyzing the ticket volume in each category, information will be obtained on which products, service requests, or problem resolutions are most frequently brought up by customers. This categorization is crucial to determine which services or products might generate the most inquiries or issues and which aspects of service delivery perform well.
RESULTS
Here are the results of the analysis of the data obtained in this research.
Customer Satisfaction Index
Table 5 shows the results of the calculation of the customer satisfaction index for the Contact Center services at PT. Jaya Bersama bank. This calculation was conducted using steps 1 to 5, as explained previously.
Based on the Customer Satisfaction Index analysis, obtained from a survey of 37 respondents, PT. Jaya Bersama achieved a score of 63%. When this score is evaluated based on the categories established in the Customer Satisfaction Index table, it indicates that customers are "Fairly Satisfied" with the Contact Center services of PT. Jaya Bersama, particularly in the aspect of handling repeated tickets.
Table 5: Customer Satisfaction Index
Item
MIS
MSS
WF
WS
1
4,05
3,14
4,68%
0,15
2
4,00
3,00
4,61%
0,14
3
4,00
3,35
4,61%
0,15
4
3,92
3,46
4,52%
0,16
5
4,03
3,05
4,65%
0,14
6
3,95
2,89
4,55%
0,13
7
4,03
3,22
4,65%
0,15
8
4,05
3,11
4,68%
0,15
9
3,86
3,16
4,46%
0,14
10
4,05
3,24
4,68%
0,15
11
3,97
3,05
4,58%
0,14
12
4,00
2,95
4,61%
0,14
13
3,81
2,92
4,40%
0,13
14
3,92
3,54
4,52%
0,16
15
3,86
3,38
4,46%
0,15
16
3,92
3,14
4,52%
0,14
17
3,81
3,05
4,40%
0,13
18
3,86
2,92
4,46%
0,13
19
3,89
3,27
4,49%
0,15
20
3,86
3,22
4,46%
0,14
21
3,84
3,11
4,43%
0,14
22
3,97
3,38
4,58%
0,15
Total
86,68
69,54
1,00
3,16
Customer Satisfaction Index (CSI)
63%
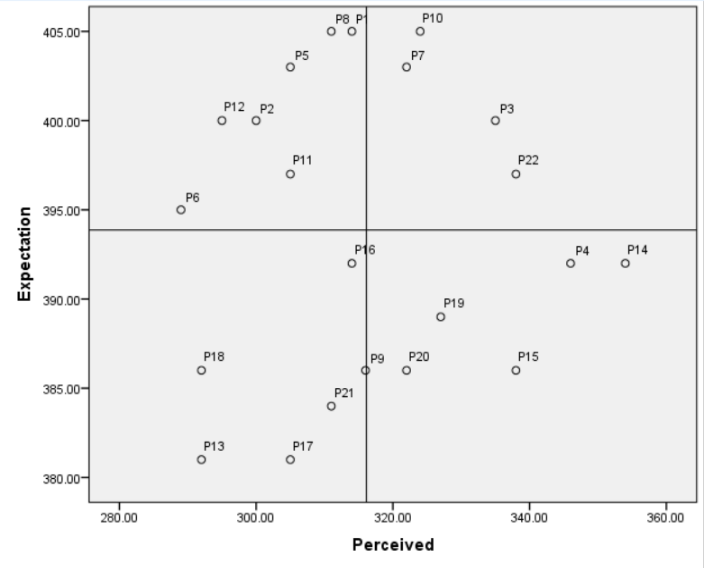
Figure 2: IPA Analysis Result
Importance Performance Analysis
Figure 2 presents the results of the required performance level (Importance Performance Analysis-IPA) using SPSS software. The results of this analysis provide insights into how well various aspects of the service meet customer expectations.
In this research, emphasis is placed on Quadrant I as the foundation of the Business Solution proposed by the author. According to the results of the IPA Analysis, Quadrant I emerges as the primary focus area, affirming its crucial role as a top priority. Here, the author explores the specific results and implications of this quadrant.
The following items fall into Quadrant I.
Understanding the Problem: Customers feel that the Contact Center makes a strong effort to understand the root of the issue to prevent repeated contact. However, there is a noticeable gap between the importance and performance scores, indicating room for improvement
Consistency and Speed: The feedback suggests that the Contact Center is quick and consistent in providing solutions, but like the first point, a gap exists, suggesting that while they are performing well, customers consider this aspect highly important and expect even better performance
Ticket Tracking System: The Contact Center’s ticket tracking system is considered easy to use by customers, allowing them to check their status effectively. Again, a gap indicates that even though the system is good, customers are looking for an even more enhanced experience
Promise Fulfillment: Customers report that the responses from the Contact Center align with what was promised. The gap is slightly smaller here, showing a closer alignment between expectations and experience but still suggests the need for improvement.
Response Time: The Contact Center seems to be delivering responses or solutions within the promised time frame, yet customers indicate that there is a gap, wanting even timelier responses
Agent Readiness: Customers find that Contact Center agents are ready and quick to respond to inquiries about ticket progress. The performance is rated quite high, but the importance is even higher, leading to a small gap.
Technological Tools: The tools provided by the Contact Center for support (phone, email, chat, direct message) are considered effective in problem resolution. Nevertheless, the performance does not fully meet the high importance customers place on this aspect.
Post-Contact Survey
The following table presents data from the Post-Contact Survey Report over a three-month period: August, September and October 2023. These tables are arranged to show the total number of tickets and details of First Contact Resolution (FCR) for three types of cases:
Table 6: Quadrant I - Main Focus
Statement
E
P
Gap
The Contact Center makes an effort to understand the root of the problem to prevent me from having to contact them repeatedly.
3,95
2,89
-1,06
The Contact Center is quick and consistent in providing solutions to the problems I experience.
4,00
2,95
-1,05
The Contact Center has a ticket tracking system that is easy for customers to view their status.
4,00
3,00
-1,00
The responses from the Contact Center are always in line with what they previously promised.
4,03
3,05
-0,98
I always receive a response or solution from the Contact Center within the promised time frame.
4,05
3,11
-0,94
Contact Center agents are always ready and quick to respond when I inquire about the progress of my ticket.
3,97
3,05
-0,92
The technological tools (e.g., Phone/Email/Chat/DM) used and provided by the Contact Center support quick and effective problem resolution.
4,05
3,14
-0,91
Table 7: Post-Contact Survey August - October 2023
Case Type
August
September
October
FCR %
FCR %
FCR %
Yes
No
Yes
No
Yes
No
Inquiry
60,77
39,23
63,88
36,12
65,14
34,86
Request
76,67
23,33
82,04
17,96
81,67
18,33
Complaint
25,00
75,00
41,10
58,90
44,19
55,81
Inquiries, Requests and Complaints. First contact resolution is the percentage of incoming service calls or requests that are resolved during the first interaction with the customer [4].
In August, the FCR rate was 60.77% for inquiries, 76.67% for requests and only 25% for complaints, indicating that complaints were the least likely to be resolved on the first contact. Conversely, 39.23% of inquiries, 23.33% of requests and a striking 75% of complaints were not resolved on the first contactSeptember showed a slight improvement in the FCR rates for inquiries and requests, at 63.88% and 82.04% respectively, but the FCR for complaints remained low at 41.10%. The non-FCR rates were 36.12% for inquiries, 17.96% for requests and 58.90% for complaints.
In October, there was a marginal increase in FCR for inquiries (65.14%) and requests (81.67%), but complaints still had a relatively low FCR rate of 44.19%. The non-FCR rates were 34.86% for inquiries, 18.33% for requests and a high 55.81% for complaints.
The consistently high percentage of non-FCR tickets, particularly for complaints, indicates a potential area for improvement in the contact center process. This suggests that the company should investigate the reasons why complaints are not resolved on first contact and take steps to enhance their resolution processes to increase overall customer satisfaction.
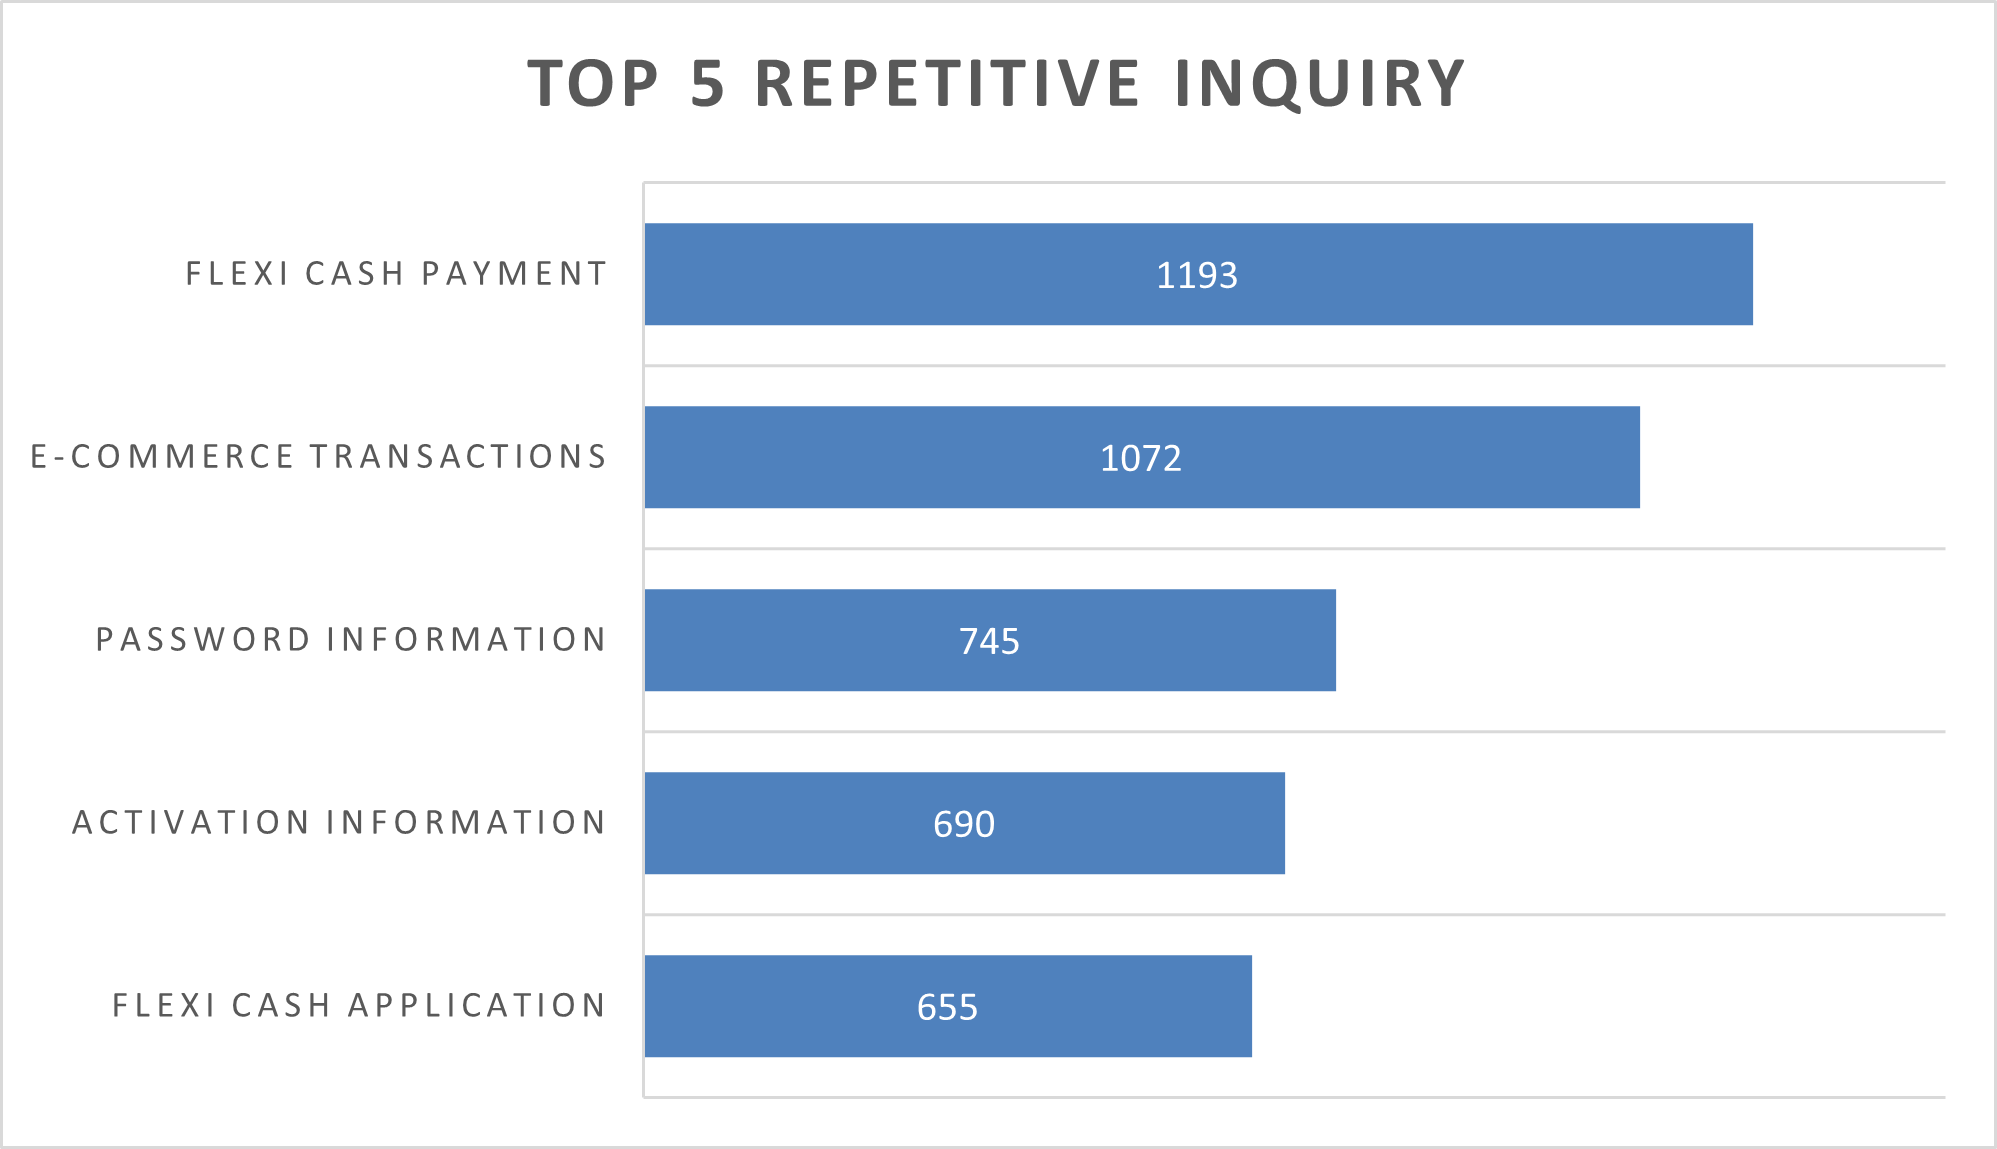
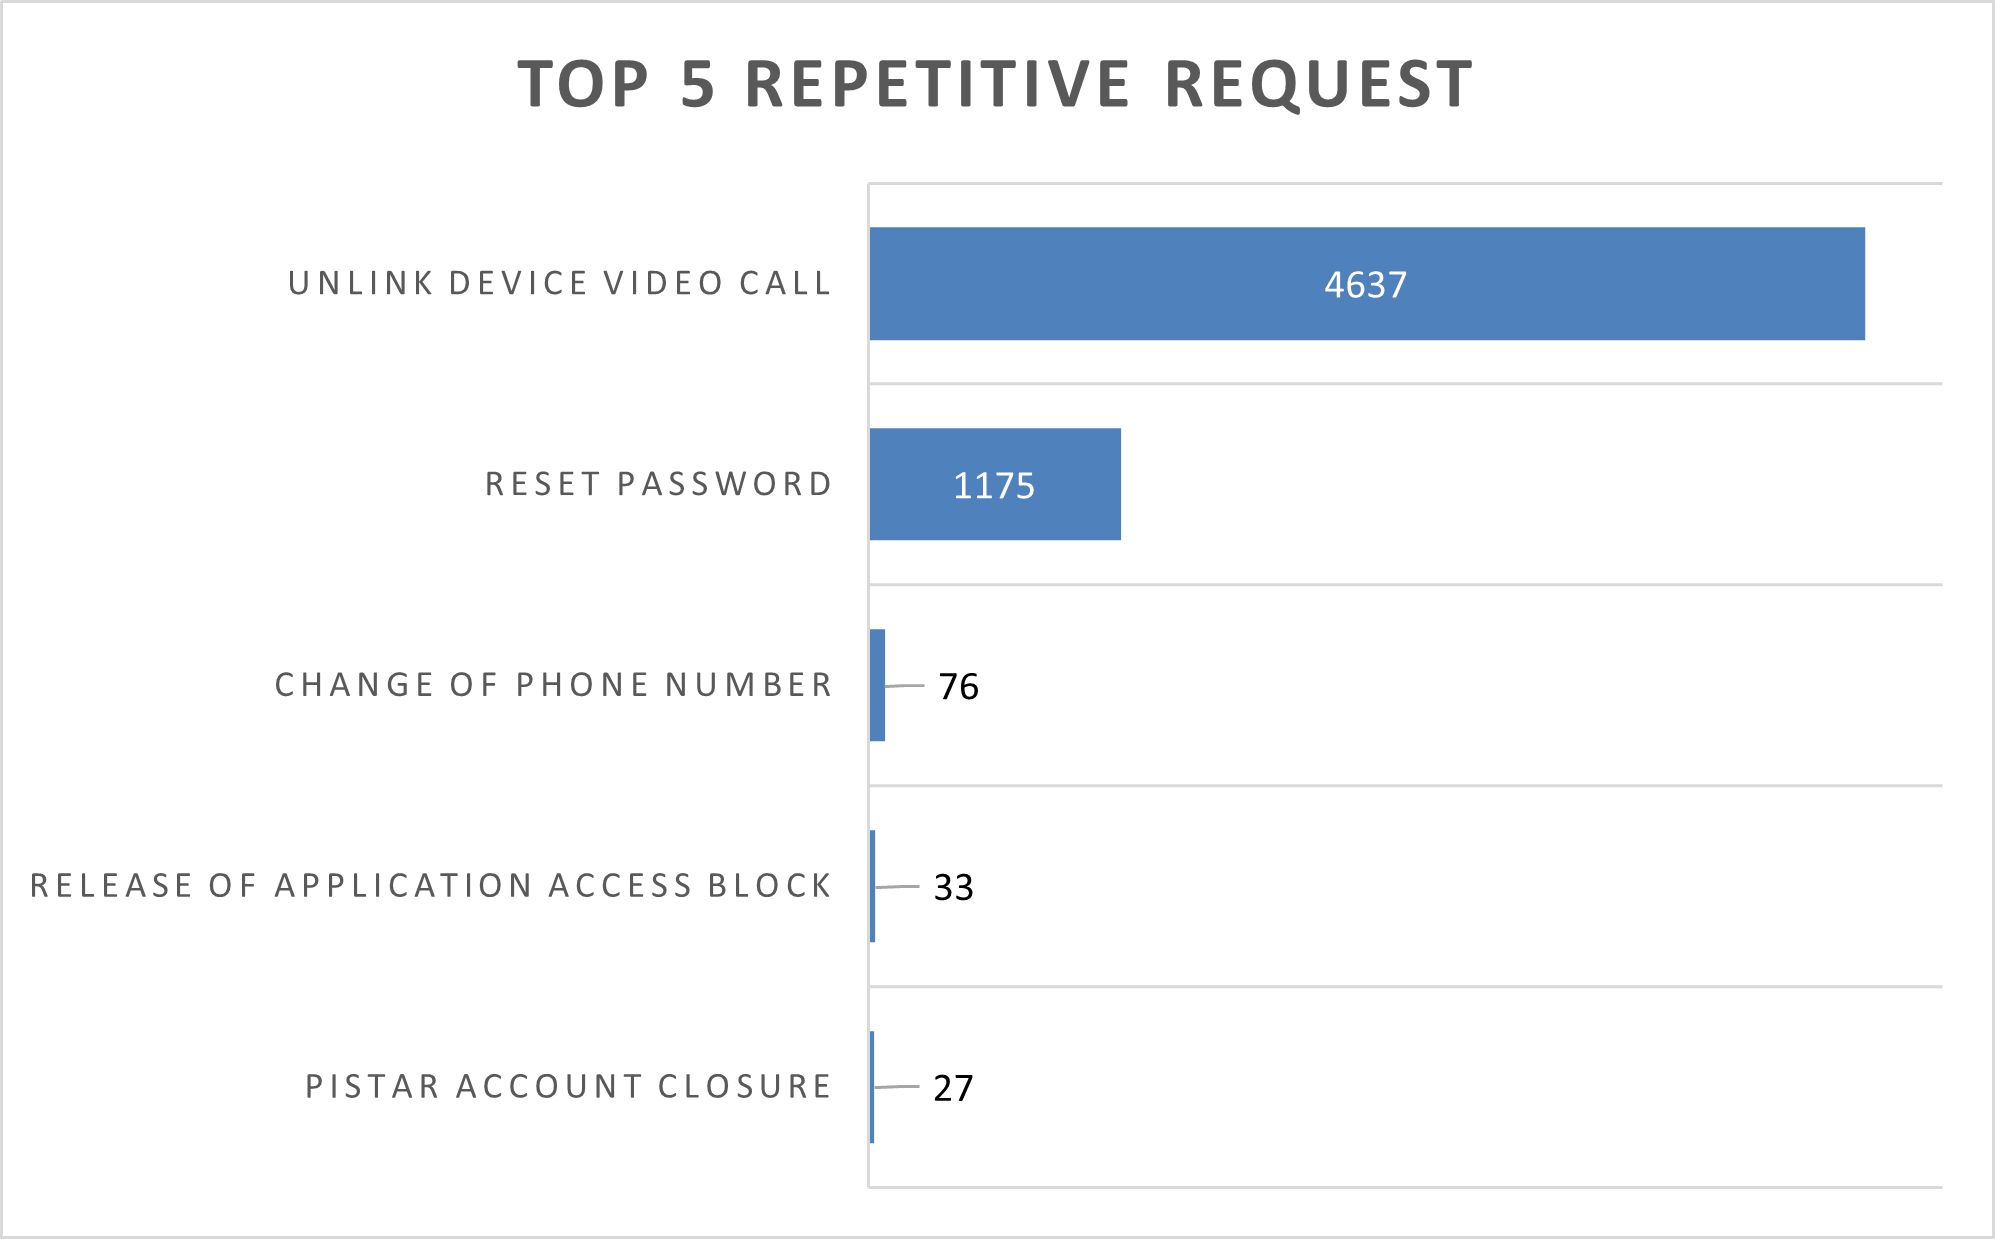
Repetitive Ticket Case Category in CRM
Here are the data for the ticket categories that most frequently experienced repeated contact. This data was collected from August 2023 to October 2023.
In general inquiries focused on payment and transaction services, with "Flexi Cash Payments" receiving 1,193 inquiries, which may indicate a need for clearer payment processing information or support. Following this was "E-commerce Transactions," reflecting a substantial number of customer interactions related to e-commerce activities. Inquiries about "Password Information" and "Activation Information" were also significant, emphasizing common issues with password security and account activation procedures. "Flexi Cash Application" was another frequently inquired area, suggesting that customers often require assistance with the Flexi Cash application.
The most frequent request was " Unlink Device Video Call"with 4,637 repetitions, indicating a widespread issue or user difficulty with the video call feature that could be addressed through technical improvements or more intuitive user guidance. "Reset Password" appears to be another significant area of customer need, with 1,175 occurrences, pointing to recurring account access issues or security concerns. Other requests like updating emergency contact numbers, application access issues and account closures, though less frequent, provide insights into other areas where the Contact Center could enhance service efficiency and user satisfaction.
For complaints, the graph shows "Flexi Cash Application Issues" as the most frequently occurring issue, with 33 cases, possibly indicating recurring difficulties or confusion faced by customers in this area.
Transaction disputes also emerged as a common complaint, with "BIFAST Transfer Disputes" and "QRIS Transaction Disputes" reported 22 and 16 times respectively. These figures indicate that dispute handling could be an area needing further attention. Additionally, "Card Activation Issues" and "Pistar Application Login Issues" were recorded 6 times each, highlighting potential challenges in the card activation process and in simplifying the login process.
Figure 3: Top 5 Case Category of Repetitive Inquiry Tickets: August - October
Figure 4: Top 5 Case Category of Repetitive Request Tickets: August – October
Figure 5: Top 5 Case Category of Repetitive Complaint Tickets: August - October
These patterns provide critical insights to the Contact Center regarding operational areas that require the most attention, indicating where customer experiences can be improved and where resource allocation can be optimized for better service delivery and customer satisfaction.
Ticket Volume in CRM Application and Main Case Categories
The following Tables 8,9,10 show the most common case categories encountered by the Contact Center, including complaints, inquiries and requests.
The Table 9 displays the top five categories of Contact Center tickets in the CRM application for August 2023.
Next are the data for September 2023.
This ongoing trend underscores the importance customers place on security measures and their need for assistance in managing device access and protecting their accounts.
Requests for device link termination via video calls increased, indicating a growing dependence on digital security and a need for real-time remote assistance. This was particularly evident in October, where the number of tickets for this request nearly doubled compared to August.
Trends in Complaints
"Issues with Transaction Disputes" became a recurring theme in the "Complaints" category. There was a consistent presence of transaction-related issues, such as with QRIS and BIFAST, highlighting ongoing challenges in transaction processing and resolution.
Table 8: Top 5 Case Category of Ticket in August 2023 (Company Data, 2023)
AUGUST 2023
Rank
Inquiry
Total Ticket
1
Security - Unlink Device Information
9499
2
Security - Password Information
5650
3
Pistar Activation - Activation Information
5020
4
Telephone - SDB Telephone Transfer
3403
5
VISA - E-Commerce Transaction
3109
Rank
Request
Total Ticket
1
Security - Unlink Device Video Call
20641
2
Security - Unlink Device by SP (execute)
3693
3
Security - Reset Password
3576
4
Need Escalation - Phone
3435
5
Pistar Savings - Closing Pistar Account
2498
Rank
Complaint
Total Ticket
1
QRIS Transaction - Dispute QRIS Transaction
427
2
Transfer Transaction - Dispute BIFAST Transfer
389
3
Transaction Issue - ATM Card Cannot Be Used
277
4
Account Activation - Account Activation Problem
254
5
Visa Transaction - Dispute Ecommerce Transaction
238
Table 9: Top 5 Case Category of Ticket in September 2023 (Company Data, 2023)
SEPTEMBER 2023
Rank
Inquiry
Total Ticket
1
Security - Unlink Device Information
8162
2
Security - Password Information
5088
3
Pistar Activation - Activation Information
3742
4
Information - Follow Up Ticket
3389
5
Telephone - Transfer Telephone SDB
3050
Rank
Request
Total Ticket
1
Security - Unlink Device Video Call
18008
2
Security - Unlink Device by SP (execute)
3849
3
Security - Reset Password
3412
4
Need Escalation - Phone
3284
5
Pistar Savings - Closing Pistar Account
2296
Rank
Complaint
Total Ticket
1
QRIS Transaction - Dispute QRIS Transaction
882
2
Transfer Transaction - Dispute BIFAST Transfer
663
3
Pistar Access - Pistar Login Issue
387
4
Visa Transaction - Dispute Ecommerce Transaction
261
5
Paylater - Paylater Menu Not Available
234
October showed an increase in credit disputes, including services like "Paylater", indicating emerging issues with newer financial products or services.
And finally, here are the data for the ticket categories in October 2023.
From the data, the following analysis results were obtained:
Trends in Inquiries and Requests
"Security", especially concerning "Device Link Termination" and "Password" information, consistently topped the list of customer inquiries and requests over the three months.
Table 10. Top 5 Case Category of Ticket in October 2023 (Company Data, 2023)
OCTOBER 2023
Rank
Inquiry
Total Ticket
1
Security - Unlink Device Information
6700
2
Security - Password Information
3915
3
Information - Follow Up Ticket
3372
4
Flexi Cash - Flexi Cash Payment
3087
5
Pistar Activation - Activation Information
2660
Rank
Request
Total Ticket
1
Security - Unlink Device Video Call
17192
2
Need Escalation - Phone
3522
3
Security - Unlink Device by SP (execute)
3454
4
Pistar Savings - Closing Pistar Account
2411
5
Document Request - STP2
2054
Rank
Complaint
Total Ticket
1
QRIS Transaction - Dispute QRIS Transaction
617
2
Paylater - Paylater Menu Not Available
503
3
Credit Card Application - Credit Card –
Credit Card Application Issue
373
4
Transfer Transaction - Dispute BIFAST Transfer
368
5
Feature - Credit Card - Application Feature Issue
326
Figure 6: Process Flow with Proposed Solution for Ticket Reception at the Contact Center
Data from August to October revealed a contact center landscape highly focused on digital security (with inquiries about "Device Link Termination" and "Passwords") and financial transaction integrity. These consistent concerns may point to areas where the company needs to invest in enhancing security protocols and simplifying transaction resolution processes to improve customer satisfaction and trust.
Proposed Solution
Based on the in-depth data analysis presented in the previous chapters, combined with comparative analysis, this study has identified the main challenges faced by the Contact Center of PT. Jaya Bersama, particularly relating to the high volume of repeated customer contacts and its impact on operational efficiency and customer satisfaction. It was found that improving the First Contact Resolution (FCR) rate could be a strategic solution in addressing these issues. Therefore, this proposal aims to introduce innovative and effective business solutions designed to optimize FCR and enhance customer satisfaction at PT. Jaya Bersama.
Drawing from the findings gathered, this proposal suggests the implementation of two main strategies: a Pull concept and a Proactive (Push) approach in Contact Center services.
The Pull strategy allows customers to independently obtain information about the status of their tickets, either through a ticket tracking feature in the Mobile Banking app or through enhanced interaction with chatbots. Conversely, the Push strategy aims to make the Contact Center more proactive in providing ticket status updates to customers through communication channels like WhatsApp, email and Mobile Banking app notifications.
The proposed solution involves two main integrations
Ticket Tracking and Transaction Dispute Status Enhancement through Chatbot and Mobile Banking App Functionality
Focus on enhancing the capabilities of existing chatbots within the banking service framework. The goal is to integrate the chatbot directly with the bank's Customer Relationship Management (CRM) application. This integration is designed to enable the chatbot to access and relay the current status of service tickets directly to customers.
Push Notification (Proactive Updates)
Besides providing self-service features, the Contact Center should also implement proactive updates through regular Push Notifications to customers about the progress of their tickets. This approach will enhance the customer experience by ensuring they feel their concerns are continuously addressed by the Contact Center until their issues are resolved.
These regular updates ideally should be personalized for each customer. This means that updates should be communicated empathetically and through the customer's preferred channels, such as Email, SMS, or Mobile App Notifications. This tailored approach will not only keep customers well-informed but also convey a sense of care and attention to their specific needs, further enhancing the overall customer service experience.
If the ticketing process flow is depicted in a diagram incorporating the two proposed solutions mentioned above, then the flow is as Figure 6.
CONCLUSION
This research concludes that the overall customer satisfaction for PT. Jaya Bersama is in the "Fairly Satisfied" category, with a Customer Satisfaction Index (CSI) score of 63%. However, there are shortcomings in customer satisfaction regarding the handling of Repeated Contacts by the Contact Center, evidenced by a negative gap between customer expectations and perceptions of the service at PT. Jaya Bersama. Service quality improvements need to be focused on aspects with the highest negative gaps, particularly in the handling time of repeated tickets, to enhance customer satisfaction.
Key factors identified include the need for a deeper or more consistent understanding of problems, more efficient service processes, improved ticket tracking systems, faster responses, ongoing agent training and the enhancement of technological tools. PT. Jaya Bersama also emphasizes the implementation of self-service technology and proactive communication to improve First Contact Resolution (FCR) and reduce repeated contacts. The integration of chatbot functions and the enhancement of the mobile banking application, as well as the proactive use of push notifications, are expected to reduce the burden on the customer service center and increase overall customer satisfaction.
REFERENCES
Parasuraman, A. et al. (1988). SERVQUAL: A Multiple-Item Scale for Measuring Consumer Perceptions of Service Quality. Journal of Retailing.
Tavakol, M. and Dennick, R. (2011). Making Sense of Cronbach’s Alpha. International Journal of Medical Education, 2, 53–55.
Martilla, J.A. and James, J.C. (1977). Importance-Performance Analysis. Journal of Marketing, 41(1), 77–79.
Hertvik, J. (2020). First Contact Resolution (FCR) for Improving Customer Satisfaction. Retrieved from https://www.bmc.com/blogs/first-contact-resolution-for-improved-customer-satisfaction/ [Accessed 17 September 2023].
Advertisement
Recommended Articles
Research Article
Modelling Structure Job Quality, Job Design and Job Satisfaction
Moch Nurhadi,
...
Avi Sunani
Published: 30/08/2022
Download PDF
Cite
x
APA
Nurhadi, M., Bisyri Effendi, M., Saiful Ulum, A. & Sunani, A. (2022). Modelling Structure Job Quality, Job Design and Job Satisfaction. Himalayan Journal of Economics and Business Management, 3(2), 1-4.
MLA
Nurhadi, Moch, et al. "Modelling Structure Job Quality, Job Design and Job Satisfaction." Himalayan Journal of Economics and Business Management 3.2 (2022): 1-4.
Chicago
Nurhadi, Moch, Moch Bisyri Effendi, Achmad Saiful Ulum and Avi Sunani. "Modelling Structure Job Quality, Job Design and Job Satisfaction." Himalayan Journal of Economics and Business Management 3, no. 2 (2022): 1-4.
Harvard
Nurhadi, M., Bisyri Effendi, M., Saiful Ulum, A. and Sunani, A. (2022) 'Modelling Structure Job Quality, Job Design and Job Satisfaction' Himalayan Journal of Economics and Business Management 3(2), pp. 1-4.
Vancouver
Nurhadi M, Bisyri Effendi M, Saiful Ulum A, Sunani A. Modelling Structure Job Quality, Job Design and Job Satisfaction. Himalayan Journal of Economics and Business Management. 2022 Jul;3(2):1-4.
Download PDF
Research Article
Accountability and Transparency of Village Fund Management in Lumajang District
Nurina Ayuningtiyas,
...
Muhammad Miqdad
Published: 28/12/2023
Download PDF
Cite
x
APA
Ayuningtiyas, N., Santosa Putra, H. & Miqdad, M. (2023). Accountability and Transparency of Village Fund Management in Lumajang District. Himalayan Journal of Economics and Business Management, 4(2), 1-4.
MLA
Ayuningtiyas, Nurina, Hendrawan Santosa Putra and Muhammad Miqdad. "Accountability and Transparency of Village Fund Management in Lumajang District." Himalayan Journal of Economics and Business Management 4.2 (2023): 1-4.
Chicago
Ayuningtiyas, Nurina, Hendrawan Santosa Putra and Muhammad Miqdad. "Accountability and Transparency of Village Fund Management in Lumajang District." Himalayan Journal of Economics and Business Management 4, no. 2 (2023): 1-4.
Harvard
Ayuningtiyas, N., Santosa Putra, H. and Miqdad, M. (2023) 'Accountability and Transparency of Village Fund Management in Lumajang District' Himalayan Journal of Economics and Business Management 4(2), pp. 1-4.
Vancouver
Ayuningtiyas N, Santosa Putra H, Miqdad M. Accountability and Transparency of Village Fund Management in Lumajang District. Himalayan Journal of Economics and Business Management. 2023 Jul;4(2):1-4.
Download PDF
Research Article
Influence of Leadership on Poverty Reduction in the Devolved Government in Trans-Nzoia County, Kenya
Kinisu Sifuna,
...
Peter Simotwo
Published: 30/06/2021
Download PDF
Cite
x
APA
Sifuna, K., Lwangale, D. W., Simotwo, P., Sifuna, K., Lwangale, D. W. & Simotwo, P. (2021). Influence of Leadership on Poverty Reduction in the Devolved Government in Trans-Nzoia County, Kenya. Himalayan Journal of Economics and Business Management, 2(1), None-None.
MLA
Sifuna, Kinisu, et al. "Influence of Leadership on Poverty Reduction in the Devolved Government in Trans-Nzoia County, Kenya." Himalayan Journal of Economics and Business Management 2.1 (2021): None-None.
Chicago
Sifuna, Kinisu, David W. Lwangale, Peter Simotwo, Kinisu Sifuna, David W. Lwangale and Peter Simotwo. "Influence of Leadership on Poverty Reduction in the Devolved Government in Trans-Nzoia County, Kenya." Himalayan Journal of Economics and Business Management 2, no. 1 (2021): None-None.
Harvard
Sifuna, K., Lwangale, D. W., Simotwo, P., Sifuna, K., Lwangale, D. W. and Simotwo, P. (2021) 'Influence of Leadership on Poverty Reduction in the Devolved Government in Trans-Nzoia County, Kenya' Himalayan Journal of Economics and Business Management 2(1), pp. None-None.
Vancouver
Sifuna K, Lwangale DW, Simotwo P, Sifuna K, Lwangale DW, Simotwo P. Influence of Leadership on Poverty Reduction in the Devolved Government in Trans-Nzoia County, Kenya. Himalayan Journal of Economics and Business Management. 2021 Jan;2(1):None-None.
Download PDF
Research Article
The Effect of Return on Investment (Roi) as a Decision-Making Instrument on The Share Value of Food and Beverage Companies Listed on The Bei for the Period 2021-2022
Fathurrozi Azhar Edyansyah,
...
Agung Budi Sulistiyo
Published: 05/07/2025
Download PDF
Cite
x
APA
Azhar Edyansyah, F., Prasetyo, W. & Budi Sulistiyo, A. (2025). The Effect of Return on Investment (Roi) as a Decision-Making Instrument on The Share Value of Food and Beverage Companies Listed on The Bei for the Period 2021-2022. Himalayan Journal of Economics and Business Management, 6(2), 1-4.
MLA
Azhar Edyansyah, Fathurrozi, Whedy Prasetyo and Agung Budi Sulistiyo. "The Effect of Return on Investment (Roi) as a Decision-Making Instrument on The Share Value of Food and Beverage Companies Listed on The Bei for the Period 2021-2022." Himalayan Journal of Economics and Business Management 6.2 (2025): 1-4.
Chicago
Azhar Edyansyah, Fathurrozi, Whedy Prasetyo and Agung Budi Sulistiyo. "The Effect of Return on Investment (Roi) as a Decision-Making Instrument on The Share Value of Food and Beverage Companies Listed on The Bei for the Period 2021-2022." Himalayan Journal of Economics and Business Management 6, no. 2 (2025): 1-4.
Harvard
Azhar Edyansyah, F., Prasetyo, W. and Budi Sulistiyo, A. (2025) 'The Effect of Return on Investment (Roi) as a Decision-Making Instrument on The Share Value of Food and Beverage Companies Listed on The Bei for the Period 2021-2022' Himalayan Journal of Economics and Business Management 6(2), pp. 1-4.
Vancouver
Azhar Edyansyah F, Prasetyo W, Budi Sulistiyo A. The Effect of Return on Investment (Roi) as a Decision-Making Instrument on The Share Value of Food and Beverage Companies Listed on The Bei for the Period 2021-2022. Himalayan Journal of Economics and Business Management. 2025 Jul;6(2):1-4.
Supriady Pasaribu, J., Aldianto, L. & Hutajulu, S. (2024). Enhancing Customer Satisfaction in Digital Contact Experience Center: An Analysis of Service Quality, A Case Study in pt. Bank Jaya Bersama. Himalayan Journal of Economics and Business Management, 5(1), 1-9.
MLA
Supriady Pasaribu, Jefry, Leo Aldianto and Sahat Hutajulu. "Enhancing Customer Satisfaction in Digital Contact Experience Center: An Analysis of Service Quality, A Case Study in pt. Bank Jaya Bersama." Himalayan Journal of Economics and Business Management 5.1 (2024): 1-9.
Chicago
Supriady Pasaribu, Jefry, Leo Aldianto and Sahat Hutajulu. "Enhancing Customer Satisfaction in Digital Contact Experience Center: An Analysis of Service Quality, A Case Study in pt. Bank Jaya Bersama." Himalayan Journal of Economics and Business Management 5, no. 1 (2024): 1-9.
Harvard
Supriady Pasaribu, J., Aldianto, L. and Hutajulu, S. (2024) 'Enhancing Customer Satisfaction in Digital Contact Experience Center: An Analysis of Service Quality, A Case Study in pt. Bank Jaya Bersama' Himalayan Journal of Economics and Business Management 5(1), pp. 1-9.
Vancouver
Supriady Pasaribu J, Aldianto L, Hutajulu S. Enhancing Customer Satisfaction in Digital Contact Experience Center: An Analysis of Service Quality, A Case Study in pt. Bank Jaya Bersama. Himalayan Journal of Economics and Business Management. 2024 Jan;5(1):1-9.