The Effect of Return on Investment (Roi) as a Decision-Making Instrument on The Share Value of Food and Beverage Companies Listed on The Bei for the Period 2021-2022
Fathurrozi Azhar Edyansyah
1
,
Whedy Prasetyo
2
,
Agung Budi Sulistiyo
3
1
University of Jember, Graduate Student, Faculty of Economics and Business, Indonesia
2
University of Jember, Lecturer at the Faculty of Economics and Business, Indonesia
3
Lecturer at the Faculty of Economics and Business, University of Jember, Indonesia
The view of stock investment as a solution in overcoming the financial instability of companies in the midst of a crisis has become a major concern. Investors seek returns through stock investments and expect to earn a favorable return on investment (ROI). This study reveals that ROI affects the financial performance of a company and has an impact on its stock value. The graph of the relationship between ROI and stock value illustrates the close relationship between this financial instrument and the estimated value of a company's stock. This study aims to investigate the effect of ROI on the stock value of food and beverage companies in the hope of gaining better insights than previous research. This research is based on the observation that ROI can be used as a significant financial performance indicator in investment decision making. By evaluating the financial performance of a company, investors can make smarter investment decisions, reduce risks, and increase profit opportunities. This study adopts a quantitative descriptive method and uses secondary data from the financial statements of 15 food and beverage companies listed on the Indonesia Stock Exchange in the 2021-2022 period.
Keywords
Retun on Investment
ROI
Share Value
INTRODUCTION
A company must want to grow rapidly and gain as much profit as possible, but not always a company can maintain its financial benefits. One of the ways companies can survive their unprofitability is by attracting investors through investment in buying and selling shares. Investing in company shares is one of the most popular forms of investment among investors. In addition, by owning shares, investors also have the opportunity to own a small portion of the company whose shares are purchased. Shares will also be used by the company as capital in the company's operational activities. Investors who buy shares will certainly expect a return given by the company, the return in question is dividends.
However, in deciding to buy shares, investors cannot make decisions carelessly. Because, stocks are an investment that is not stable in value. Investors need to consider various factors before deciding to buy shares of a company. One of the determining factors in making stock purchase decisions is by looking at the financial performance of a company. By looking at the company's performance, an investor can consider whether the company has the potential expected by investors or not. Therefore, a decision-making instrument is needed. One of the decision-making instruments in purchasing shares, among others, is by looking at the financial performance of a company.
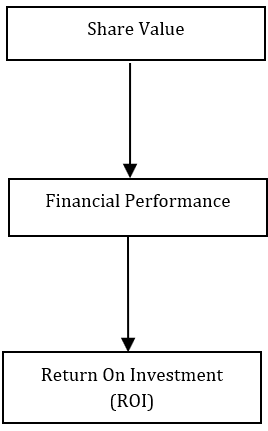
Investors certainly hope for a company that can make a good profit. Investors can also see whether a company makes a profit or loss through the return on investment (ROI) of the company's financial performance. Financial performance itself is a form of a report on the financial review of a company obtained in a certain period with the intention of knowing the financial flow of a company. According to research conducted by Sandry and Rosa [1], the results of the calculation of return on investment (ROI) are very influential on the assessment of the financial performance of a company which is then based on the financial performance obtained an estimate of the value of the shares of the company. So it can be described in Figure 1.
Because according to the research exposure of Fariatin [2] which explains that return on investment (ROI) can also be used as an instrument for assessing the financial performance of a company. Meanwhile, according to the results of Supriadi's research [3], it explains that financial performance can affect stock value because the company's financial performance reflects how a company can
Figure 1: Graph of the Relationship Between Roi and Share Value
manage and manage their internal economic conditions. So this research was conducted with the intention of wanting to find out whether return on investment (ROI) can affect the value of shares of food and beverage companies in the hope of obtaining better results or different results from previous research.
Literature Review
Return on Investment (ROI): Return on investment (ROI) is the level of profit expected by investors from their investment. ROI is a financial ratio that measures investment efficiency by comparing the net profit earned from investment with investment costs. According to Adiwinata [4] who explains that the ROI value can be taken into consideration by investors before buying shares because it gives an idea of how efficient and profitable the investment is. Investors tend to choose stocks from companies that offer high ROI, because this shows that the company is able to generate good returns on their investment. ROI is also used as a measure of the company's financial performance and can be a consideration in making investment decisions. The following formula is how to calculate ROI according to Syamsudin [5]:
Description:
NPAT = Company’s net profit after all expenses
Total Assets = Total assets owned by the company
ROI is calculated by dividing net profit by total investment cost. ROI is often used by investors to evaluate the performance of an investment and compare with other investments. The higher the ROI, the more efficient the investment. Nasution [6] explained in his research that there are several factors that can affect the ROI value, namely sales factors, operating costs, cash payment rates, and inventory payment rate factors. So that when calculating the ROI value, it is recommended to use other financial metrics simultaneously to evaluate overall investment performance [7].
Financial Performance
Financial performance refers to the financial evaluation of an entity, such as a company or bank, that reflects their ability to generate profits and growth. Financial performance can be measured by various metrics, including financial ratios such as liquidity ratios, solvency ratios, activity ratios, and profitability ratios [8]. These metrics provide an overview of various aspects of financial performance, such as the company's ability to meet short-term obligations, the company's level of dependence on debt, the efficiency of asset use, and the company's ability to generate profits from its operations. In addition, according to research by Oktavianus et al. [9] explained that financial performance can affect the company's reputation because good financial performance can improve the company's reputation in the eyes of stakeholders, such as investors, customers, and partners. Conversely, poor financial performance can damage the company's reputation and reduce stakeholder trust in the company.
For example, research shows that good financial performance has a positive and significant effect on corporate reputation, while corporate reputation also has a positive and significant effect on financial performance. In addition, financial performance is also a consideration for investors in buying company shares, so that it can affect the company's stock price [10].
Shares Dan Share Value
Shares are one of the financial instruments that represent partial ownership of a company. In other words, shares are proof of a person's or institution's ownership of a company. Meanwhile, stock value is the price set for each share traded on the stock market. The stock price itself is influenced by several factors, one of which is demand and supply in the stock market, as well as by the company's financial performance and reputation [11]. Therefore, investors need to pay attention to these factors in buying stocks and consider the risks and potential benefits of stock investment. Investors buy shares with the expectation that the share price will rise in the future, so they can sell the shares at a higher price and make a profit. In addition, investors can also benefit from dividends paid by the company to shareholders.
MATERIALS AND METHODS
This type of research uses secondary data with the research object of food and beverage companies listed on the Indonesia Stock Exchange (IDX), totaling 15 companies. The sample selection method used in this study uses purposive sampling method with the criteria that food and beverage companies have published their financial reports within the period 2021-2022. The data in the study is annual data derived from the company's financial statements. The research period is 2 (two) years, namely 2021 and 2022. The analysis method used is quantitative descriptive method. Quantitative descriptive method is a method that uses data analysis by describing or describing the results of calculations through certain statistics [12].
RESULTS
Return On Investment (ROI) Analysis Result
Calculating return on investment is done by first finding the value of NPAT or net operating lаbа after pаjаk and total assets or total assets of the company, both of which can be seen in the annual financial statements so that the NPAT and total assets of 15 food and beverage companies in the 2021-2022 period are obtained in th Table 1.
Table 1: Table of Npat and Total Assets of Each Food and Beverage Company for the 2021-2022 Period
CAMP
Year
NPAT
Total Assets
ROI
2021
100.066.615.090
1.147.260.611.703
0,087222
2022
121.257.336.904
1.074.777.460.412
0,112821
COCO
Year
NPAT
Total Assets
ROI
2021
8.532.631.708
370.684.311.428
0,023019
2022
6.620.432.696
485.054.412.584
0,013649
DMND
Year
NPAT
Total Assets
ROI
2021
351.470.000.000
6.297.287.000.000
0,055813
2022
382.105.000.000
6.878.297.000.000
0,055552
FOOD
Year
NPAT
Total Assets
ROI
2021
14.658.771.261
106.495.352.963
0,137647
2022
22.068.477.089
102.297.196.494
0,215729
GOOD
Year
NPAT
Total Assets
ROI
2021
492.637.672.186
6.766.602.280.143
0,072804
2022
521.714.035.585
7.327.371.934.290
0,071201
ICBP
Year
NPAT
Total Assets
ROI
2021
7.900.282.000.000
118.066.628.000.000
0,066914
2022
5.722.194.000.000
115.305.536.000.000
0,049626
INDF
Year
NPAT
Total Assets
ROI
2021
11.203.585.000.000
179.356.193.000.000
0,062466
2022
9.192.569.000.000
180.433.300.000.000
0,050947
KEJU
Year
NPAT
Total Assets
ROI
2021
144.700.268.968
767.726.284.113
0,188479
2022
117.370.750.383
860.100.358.989
0,136462
MYOR
Year
NPAT
Total Assets
ROI
2021
1.211.052.647.953
19.917.653.265.528
0,060803
2022
1.970.064.538.149
22.276.160.695.411
0,088438
PCAR
Year
NPAT
Total Assets
ROI
2021
1.278.943.527
108.995.625.626
0,011734
2022
4.932.754.628
102.809.758.188
0,047979
PSDN
Year
NPAT
Total Assets
ROI
2021
-81.182.064.990
708.894.784.885
-0,1145192
2022
-25.834.965.122
705.620.167.464
-0,03661313
PSGO
Year
NPAT
Total Assets
ROI
2021
213.841.959.820
3.731.907.652.769
0,057300978
2022
257.682.130.697
4.140.857.067.187
0,062229178
SKBM
Year
NPAT
Total Assets
ROI
2021
29.707.421.605
1.970.428.120.056
0,015076633
2022
86.635.603.936
2.042.199.577.083
0,042422692
STTI
Year
NPAT
Total Assets
ROI
2021
617.573.766.863
3.919.243.683.748
0,15757473
2022
624.524.005.786
4.590.737.849.889
0,136040006
ULTJ
Year
NPAT
Total Assets
ROI
2021
1.276.793.000.000
7.406.856.000.000
0,172379887
2022
965.486.000.000
7.376.375.000.000
0,130888953
Table 2: Table of the Results of the Calculation of Roi Value (%) Along with A Description of 15 Food and Beverage Companies in the 2021-2022 Period
ROI Value (%)
Keterangan
Company Codename
Year
2021
2022
CAMP
8,72%
11,20%
Increase
COCO
2,30%
1,36%
Decline
DMND
5,58%
5,55%
Decline
FOOD
13,70%
21,50%
Increase
GOOD
7,28%
7,12%
Decline
ICBP
6,69%
4,96%
Decline
INDF
6,24%
5,09%
Decline
KEJU
18,80%
13,60%
Decline
MYOR
6,08%
8,84%
Increase
PCAR
1,17%
4,79%
Increase
PSDN
-11,40%
-3,66%
Increase
PSGO
5,73%
6,22%
Increase
SKBM
1,50%
4,24%
Increase
STTI
15,70%
13,60%
Decline
ULTJ
17,20%
13%
Decline
According to the results of the ROI value analysis, it can be seen that out of 15 companies 7 of them experienced an increase in ROI value. However, there is 1 company which, despite experiencing an increase, still shows a minus value where the company's economic situation is experiencing a loss. The ROI value obtained shows the efficiency and profitability of a company's investment. Because ROI calculates the ratio between the net profit earned from investment and investment costs. According to Fariantin [2], it is explained that the higher the ROI value, the more efficient and profitable the investment. ROI can be a consideration for investors in choosing an investment, because ROI can provide an overview of how much profit can be obtained from the investment. However, ROI also has weaknesses, namely not considering the time factor and investment risk. Therefore, ROI should be used in conjunction with other financial metrics to evaluate overall investment performance.
CONCLUSION
Based on the results of the ROI analysis, there are 7 out of 15 samples of food and beverage companies that have increased ROI. This shows that these 7 companies have a fairly good level of investment efficiency and profitability, seen from the increasing percentage when compared to the previous year in 2021. Meanwhile, 8 other companies experienced a decrease in ROI value, which indicates that these companies are not good in terms of investment efficiency and profitability.
REFERENCE
Sandry R. et al. “Analisis pengaruh return on investment dan residual income untuk menilai kinerja keuangan di suatu perusahaan.” Analysis: Accounting, Management, Economics, and Business, vol. 1, no. 2, 2023, pp. 91–102.
Fariantin E. et al. “Analisis return on investment (ROI) dan residual income (RI) dengan pendekatan du pont system untuk menilai kinerja keuangan pada PT Gudang Garam Tbk yang terdaftar di Bursa Efek Indonesia.” Valid Jurnal Ilmiah, vol. 16, no. 2, 2019, pp. 180–187.
Supriadi Y. “Pengaruh kinerja keuangan terhadap harga saham.” Financial Performance, vol. 1, no. 1, 2013, pp. 53–68.
Adiwinata D.M. et al. “Analisis return on investment (ROI) dan residual income (RI) guna menilai kinerja keuangan perusahaan (studi pada PT Nippon Indosari Corpindo Tbk yang terdaftar di Bursa Efek Indonesia periode 2012–2015).” Jurnal Administrasi Bisnis, vol. 45, no. 1, 2017, pp. 111–117.
Syamsuddin L. “Manajemen keuangan perusahaan: konsep aplikasi dalam: perencanaan, pengawasan, dan pengambilan keputusan.” Jakarta: Rajawali Pers, 2009.
Nasution S.A. et al. “Analisis faktor-faktor yang.”
Chaeriyah I. et al. “Pengaruh earning per share (EPS) dan return on investment (ROI) terhadap harga saham pada sektor perbankan.” Jurnal Ilmu Manajemen, vol. 3, no. 3, 2020, pp. 403–412.
Jumingan “Analisis laporan keuangan.” Jakarta: Bumi Aksara, 2011.
Oktavianus L.C. et al. “Kinerja keuangan dan reputasi perusahaan: studi pada perusahaan yang terdaftar di Bursa Efek Indonesia.” Jurnal KRISNA, vol. 13, no. 2, 2022, pp. 219–227.
Ariani Y. “Harga saham ritel dalam masa pandemi terkait NPM, CR dan EPS.” Balance Vacation Accounting Journal, vol. 1, no. 4, 2021, pp. 64–77.
Ediningsih S.I. et al. “Perbedaan kinerja keuangan sebelum dan saat pandemi COVID-19 pada perusahaan makanan dan minuman di Bursa Efek Indonesia.”
Sugiyono “Metode penelitian kuantitatif, kualitatif dan RandD.” Bandung: Alfabeta, 2009.
Jumingan “Analisis laporan keuangan.” Jakarta: Bumi Aksara, 2011
Advertisement
Recommended Articles
Research Article
The Role of Green Strategic Management and Green Governance in the Efficiency of Sustainable Public Service Delivery: An Applied Study in the Rifa'i District Municipality
Habeeb Wateen Mankhi
Published: 05/07/2025
Download PDF
Cite
x
APA
Wateen Mankhi, H. (2025). The Role of Green Strategic Management and Green Governance in the Efficiency of Sustainable Public Service Delivery: An Applied Study in the Rifa'i District Municipality. Himalayan Journal of Economics and Business Management, 6(2), 1-18.
MLA
Wateen Mankhi, Habeeb. "The Role of Green Strategic Management and Green Governance in the Efficiency of Sustainable Public Service Delivery: An Applied Study in the Rifa'i District Municipality." Himalayan Journal of Economics and Business Management 6.2 (2025): 1-18.
Chicago
Wateen Mankhi, Habeeb. "The Role of Green Strategic Management and Green Governance in the Efficiency of Sustainable Public Service Delivery: An Applied Study in the Rifa'i District Municipality." Himalayan Journal of Economics and Business Management 6, no. 2 (2025): 1-18.
Harvard
Wateen Mankhi, H. (2025) 'The Role of Green Strategic Management and Green Governance in the Efficiency of Sustainable Public Service Delivery: An Applied Study in the Rifa'i District Municipality' Himalayan Journal of Economics and Business Management 6(2), pp. 1-18.
Vancouver
Wateen Mankhi H. The Role of Green Strategic Management and Green Governance in the Efficiency of Sustainable Public Service Delivery: An Applied Study in the Rifa'i District Municipality. Himalayan Journal of Economics and Business Management. 2025 Jul;6(2):1-18.
Download PDF
Research Article
Modelling Structure Job Quality, Job Design and Job Satisfaction
Moch Nurhadi,
...
Avi Sunani
Published: 30/08/2022
Download PDF
Cite
x
APA
Nurhadi, M., Bisyri Effendi, M., Saiful Ulum, A. & Sunani, A. (2022). Modelling Structure Job Quality, Job Design and Job Satisfaction. Himalayan Journal of Economics and Business Management, 3(2), 1-4.
MLA
Nurhadi, Moch, et al. "Modelling Structure Job Quality, Job Design and Job Satisfaction." Himalayan Journal of Economics and Business Management 3.2 (2022): 1-4.
Chicago
Nurhadi, Moch, Moch Bisyri Effendi, Achmad Saiful Ulum and Avi Sunani. "Modelling Structure Job Quality, Job Design and Job Satisfaction." Himalayan Journal of Economics and Business Management 3, no. 2 (2022): 1-4.
Harvard
Nurhadi, M., Bisyri Effendi, M., Saiful Ulum, A. and Sunani, A. (2022) 'Modelling Structure Job Quality, Job Design and Job Satisfaction' Himalayan Journal of Economics and Business Management 3(2), pp. 1-4.
Vancouver
Nurhadi M, Bisyri Effendi M, Saiful Ulum A, Sunani A. Modelling Structure Job Quality, Job Design and Job Satisfaction. Himalayan Journal of Economics and Business Management. 2022 Jul;3(2):1-4.
Download PDF
Research Article
Accountability and Transparency of Village Fund Management in Lumajang District
Nurina Ayuningtiyas,
...
Muhammad Miqdad
Published: 28/12/2023
Download PDF
Cite
x
APA
Ayuningtiyas, N., Santosa Putra, H. & Miqdad, M. (2023). Accountability and Transparency of Village Fund Management in Lumajang District. Himalayan Journal of Economics and Business Management, 4(2), 1-4.
MLA
Ayuningtiyas, Nurina, Hendrawan Santosa Putra and Muhammad Miqdad. "Accountability and Transparency of Village Fund Management in Lumajang District." Himalayan Journal of Economics and Business Management 4.2 (2023): 1-4.
Chicago
Ayuningtiyas, Nurina, Hendrawan Santosa Putra and Muhammad Miqdad. "Accountability and Transparency of Village Fund Management in Lumajang District." Himalayan Journal of Economics and Business Management 4, no. 2 (2023): 1-4.
Harvard
Ayuningtiyas, N., Santosa Putra, H. and Miqdad, M. (2023) 'Accountability and Transparency of Village Fund Management in Lumajang District' Himalayan Journal of Economics and Business Management 4(2), pp. 1-4.
Vancouver
Ayuningtiyas N, Santosa Putra H, Miqdad M. Accountability and Transparency of Village Fund Management in Lumajang District. Himalayan Journal of Economics and Business Management. 2023 Jul;4(2):1-4.
Download PDF
Research Article
Influence of Leadership on Poverty Reduction in the Devolved Government in Trans-Nzoia County, Kenya
Kinisu Sifuna,
...
Peter Simotwo
Published: 30/06/2021
Download PDF
Cite
x
APA
Sifuna, K., Lwangale, D. W., Simotwo, P., Sifuna, K., Lwangale, D. W. & Simotwo, P. (2021). Influence of Leadership on Poverty Reduction in the Devolved Government in Trans-Nzoia County, Kenya. Himalayan Journal of Economics and Business Management, 2(1), None-None.
MLA
Sifuna, Kinisu, et al. "Influence of Leadership on Poverty Reduction in the Devolved Government in Trans-Nzoia County, Kenya." Himalayan Journal of Economics and Business Management 2.1 (2021): None-None.
Chicago
Sifuna, Kinisu, David W. Lwangale, Peter Simotwo, Kinisu Sifuna, David W. Lwangale and Peter Simotwo. "Influence of Leadership on Poverty Reduction in the Devolved Government in Trans-Nzoia County, Kenya." Himalayan Journal of Economics and Business Management 2, no. 1 (2021): None-None.
Harvard
Sifuna, K., Lwangale, D. W., Simotwo, P., Sifuna, K., Lwangale, D. W. and Simotwo, P. (2021) 'Influence of Leadership on Poverty Reduction in the Devolved Government in Trans-Nzoia County, Kenya' Himalayan Journal of Economics and Business Management 2(1), pp. None-None.
Vancouver
Sifuna K, Lwangale DW, Simotwo P, Sifuna K, Lwangale DW, Simotwo P. Influence of Leadership on Poverty Reduction in the Devolved Government in Trans-Nzoia County, Kenya. Himalayan Journal of Economics and Business Management. 2021 Jan;2(1):None-None.
Azhar Edyansyah, F., Prasetyo, W. & Budi Sulistiyo, A. (2025). The Effect of Return on Investment (Roi) as a Decision-Making Instrument on The Share Value of Food and Beverage Companies Listed on The Bei for the Period 2021-2022. Himalayan Journal of Economics and Business Management, 6(2), 1-4.
MLA
Azhar Edyansyah, Fathurrozi, Whedy Prasetyo and Agung Budi Sulistiyo. "The Effect of Return on Investment (Roi) as a Decision-Making Instrument on The Share Value of Food and Beverage Companies Listed on The Bei for the Period 2021-2022." Himalayan Journal of Economics and Business Management 6.2 (2025): 1-4.
Chicago
Azhar Edyansyah, Fathurrozi, Whedy Prasetyo and Agung Budi Sulistiyo. "The Effect of Return on Investment (Roi) as a Decision-Making Instrument on The Share Value of Food and Beverage Companies Listed on The Bei for the Period 2021-2022." Himalayan Journal of Economics and Business Management 6, no. 2 (2025): 1-4.
Harvard
Azhar Edyansyah, F., Prasetyo, W. and Budi Sulistiyo, A. (2025) 'The Effect of Return on Investment (Roi) as a Decision-Making Instrument on The Share Value of Food and Beverage Companies Listed on The Bei for the Period 2021-2022' Himalayan Journal of Economics and Business Management 6(2), pp. 1-4.
Vancouver
Azhar Edyansyah F, Prasetyo W, Budi Sulistiyo A. The Effect of Return on Investment (Roi) as a Decision-Making Instrument on The Share Value of Food and Beverage Companies Listed on The Bei for the Period 2021-2022. Himalayan Journal of Economics and Business Management. 2025 Jul;6(2):1-4.