The aim of this article is to examine the relationship of the profitability, liquidity, solvability and activity on growth of stock price study on the LQ45 Index Companies on the Indonesia Stock Exchange. From 2010 to 2019, this study used purposive sampling with 15 firms as a sample of LQ45 companies on the Indonesia Stock Exchange. Multiple linear regression with random effects model was used as the analytical method. The result of the research showed that profitability has a positive effect and significant on growth of stock price, the liquidity ratio has a negative effect and not significant on growth of stock price, the solvability ratio has a negative effect and not significant on growth stock price, the activity ratio has a positive effect and significant on growth of stock price and profitability, liquidity, solvability and activity have simultaneously affect on growth of stock price
Keywords
Profitability
Liquidity
Solvability
Activity and Stock Price
INTRODUCTION
The capital market is a marketplace when long-term investments could be traded. In general, the capital market is the same as the markets that have been encountered, except that the capital market conducts the transactions of securities. According to Keown et al. the capital market is all financial services and procedures that make long-term financial instrument. The Indonesian Stock Exchange (IDX) is a capital market in Indonesia that organizes and provides a mechanism for stock buyers and sellers.
The Indonesian Stock Exchange (IDX) was established in 1912. According to Article 1 of the Capital Market Law Number 8 of 1995, IDX is defined as a party that organizes and provides a system in buying and selling securities with the aim of trading securities. One of the products traded on the Indonesian Stock Exchange is stocks. The stocks are the proof of ownership of the company’s value. That allow companies to collect the capital from investor by issuing the stocks.
Similar to other commodities, stock are valued based on their price. The stock price is the price determined in the company to other parties who have the ownership. The value of stock prices is always changing every period. The increase and decrease in stock prices in a capital market is in line with the company performance.
Stock prices are influenced by demand and supply. The stock market’s prices fluctuate on a daily basis. The price of a stock will rise if there are more people interested in buying it than selling it. On the other hand, there will be more supply than demand if more individuals sell a stock than buy it, resulting in a decrease in the stock price. Based on the data published by the Indonesian Stock Exchange, the Jakarta composite stock price index increased significantly during the research period 2010 until 2019. The Jakarta Composite Index increased significantly from 2010 until 2015 but on the other years Jakarta Composite Index decreased significantly in 2016 and 2020. Figure 1 illustrates the fluctuation of the stock price index.
Several variables such as political occasions, overall economic conditions and investor expectations may have an impact on the stock market index. There are several types of stock price indexes on the IDX, such as the Composite Stock Price Index, Sri-Kehati Index, JII, Kompas 100 Index and Index LQ 45.
Figure 1: Jakarta Composite Stock Price Index
Source: Indonesian Stock Exchange, 2020
The LQ45 index is the stock market index which consists of 45 most liquid companies with large market capitalization. Since the establishment in February 1997, At least 70% of the stock market index and transaction data in IDX is covered by the LQ45 index. The top 60 general market common equities in the last 12 months with the highest average transaction value were selected immediately. The commodities must be included in the JCI analysis if they have been registered in the IDX have a stable financial situation for at least three months, have a high transaction frequency and also have a good financial condition.
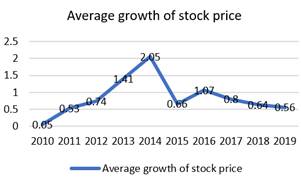
Based on the data below that published by the Indonesian Stock Exchange, the average growth of stock price during the period 2010-2019, the stock prices of 15 firms listed in LQ45. The average growth of the stock price of 15 companies fluctuate by the time during the research period. The author using purposive sampling method as a technique for selection the sampling, the author get 15 companies fulfill the criteria established listed in the IDX from 2010-2019.
Financial performance is the well-known information used by investors and potential investors in predicting the stock prices. Financial performance also provided information in financial reporting. This information is used to predict the performance of the issuer’s to determine the stock price in the company.
The main reason investor buying stock is because the stock offers the best potential returns. Each company will provide different level of return it is because each company have different performance. The investor's responsibility is to identify the company that produces the best outcomes. The company's performance will be reflected in the stock price, The company's overall performance will suffer as a result of this study.
In order to find the companies that provide the financial performance, the investor has to evaluate financial statements. To evaluate the financial statements, the investor can use the financial ratio to evaluate them. The financial ratio is used to compare different aspects of a company's financial performance and to offer basic financial data. According to Gitman and Zutter [1] Investors can use five different sorts of ratios to analyze a company's performance. Meanwhile, in this study the author use four ratio there are profitability, liquidity, solvability and activity.
The profitability ratio is a measurement used to evaluate a company's performance to earn profits, for measuring the revenue, operating cost, balance sheet, or shareholder’s equity. It also considers that the company uses the assets to generate income. The table shows the average return on assets of 15 companies listed in LQ45 in 2016 increased more than 10 percent in each year and in 2016 is the higher return on asset of the companies.
The Table 1 shows contradictions that compare the average growth of stock price as shown by Figure 1.2. When the return on asset was going up in 2016, but the average growth of stock price going up down in 2016. This information contradicts previous study by Dadrasmoghadam et al. [2] found that the return on asset show positively affects on the stock price.
A company's ability to pay off current debt is determined by liquidity ratios, pay short-term obligations and generate cash flows. The table below shows average current ratio of 15 companies listed in LQ45, during 2016-2019 in each year, the current ratio fluctuate during the research period, but in 2017 is the highest value compared to other years.
The Table 2 shows contradictions that compared the average growth of the stock price as shown by Figure 2. The current ratio was going up from 2016 until 2019, but the average growth of stock price was going down from 2016 until 2019. This information contradicts research findings by Kohansal et al. [3] found that the current ratio shows the positively affects on the stock price.
The solvability ratio is a measurement that examines the capability of the company to repay debt with a long payment. The Table 3 shows the average debt-equity ratios of 15 companies listed in LQ45 during 2016-2019 going up consistently.
The Table 3 shows contradictions that compare the average growth of stock price as shown by Figure 1.
Figure 2: Average of Growth of the Stock Price of 15 Companies Listed LQ45 during 2010-2019
Table 1: The Average Return on Asset of 15 companies Listed on the LQ45 during 2016-2019
Years
Average of Return on asset
2016
1.4
2017
0.27
2018
0.15
2019
0.15
Table 2: The average current ratio of 15 companies Listed on the LQ45 during 2016-2019
Years
Average of Current Ratio
2016
1.4066
2017
1.594
2018
1.3846
2019
1.5366
Source: Indonesia Stock Exchange, 2016-2019 (processed data)
Table 3: The average Debt equity ratio of 15 companies Listed on the LQ45 during 2016-2019
Years
Average of Debt Equity Ratio
2016
1.78866
2017
1.8553
2018
1.85
2019
2.0073
Table 4: Average of total asset turnover of 15 companies Listed on the LQ45 during 2016-2019
Years
Average of Total Asset Turnover Ratio
2016
1.291
2017
0.996
2018
0.9284
2019
0.6351
Source: Indonesia Stock Exchange, 2016-2019 (processed data)
When the debt-to-equity ratio was going up from 2016 until 2019, but the average growth of stock price was going down from 2016 until 2019. This information contradicts previous study by Snezena, the research found that the debt-equity ratio shows positively affects on the stock price.
The activity ratio is a metric for evaluating whether a company manages its resources to maximize revenue. The average total asset turnover ratio of 15 companies listed in LQ4 5 decreased from 2017 to 2019, as shown in the table below. But in 2016 is the highest value of total asset turnover compared to other years.
The Table 4 shows contradictions that compare the average growth of stock price as shown by Figure 2. When the total asset turnover ratio was going up in 2016 but, the average growth of stock price was going down in 2016. This data is contrary to the previously conducted research by Banchuenvijit [4], the research found that the total asset turnover ratio shows positively affects on the stock price.
The gap between the variables of the study, the researcher were considering the profitability, liquidity, solvability and activity ratio in comprehensive studies. This study determines a variety of firm financial ratio related to performance that is reflected by stock price to provide what financial ratio are most applicable in describing the effect on the stock price from 2010 until 2019. So, the researcher was motivated to conduct the research under the title “Financial Performance and Stock Prices in Indonesia: An Empirical Study of the Relationship between Financial Ratios and Stock Prices on the Indonesia Stock Exchange from 2010-2019.
Literature Review and Hypotheses
Stock Price
According to Subramanian, the stock price is the price of a single stock of a company's saleable equity shares. As a result, the stock price used in this study is the growth of the stock price as a proxy for the stock price.
Profitability Ratio
According to Brigham and Houston [5] the profitability ratio is a measurement for analyzing a company's overall performance. It's frequently used to assess a company's performance more than a specified period of time. The profitability ratio takes into account sales, assets, capital employed, net value and earnings per share.
Liquidity Ratio
According to Gitman [1], the liquidity ratio is a measurement for analyzing short-term obligations. In general, the higher the current ratio, the more liquid a company is should maintain track of daily assets; the lower the current ratio, the more likely there would be liquidity issues.
Solvability Ratio
According to Brigham and Houston [5] solvability ratiois used to measure how effectively a firm manages its debt. Solvability ratios include financial leverage, fixed asset to net worth ratio, interest coverage ratio, capitalization ratio and loans ratio.
Activity Ratio
According to Brigham and Houston [5], Activity ratios is used to measures how effectively the firm manages the assets. These ratios are necessary because when companies acquire assets, they must borrow capital from banks or other sources. As a result, if a company has too many assets and a high cost of capital, revenues will decline.
Theoretical Background
Signaling Theory
The Signaling theory was proposed by George A. Akerlof and developed by Ross [6]; this theory states that a company executive has better information than the investor of the company. The information provided in the form of an announcement serves as a signal to investors to continue the investment.
In signaling theory stated by Ross [6], the employers to implement out an encouraging message regarding the company's future expansion such as profitability, liquidity, solvability and activity and lead to the increase of stock price. In other words, if a company provides a signal with the good news on the market, then the stock price will increase and if a company signal informs bad news of the market, then the stock price will decrease.
The Capital Structure Theory
Modigliani and Miller proposed the capital structure theory in 1958, which shows how a company's long-term finance system combines with debt and equity. The capital structure defines the long-term debt and equity composition that should be accomplished of a company. In this study, the research describes an explanation of financial ratios and the relation to the stock price of the companies. So, the author choose the pecking order theory and signaling model asymmetry information theory which will be explained in the paragraph below.
Pecking Order Theory
This theory from Myers and Majluf explains, the profitable company generally their have a tendency to use less debt. This is not because the company has the lower target debt ratio, because they require less amount of external financing. The company in not profitable condition will tend to use larger debt because the internal funds are sufficient and the external funds more preferred its debt.
Previous Research
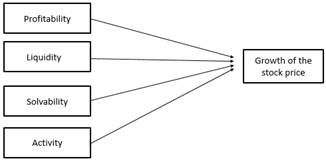
Research Framework
Hypotheses
The Relations Between Profitability and Stock Price
The increase in economic value of a company will attract the interest of investors to repurchase its company shares. Therefore, the higher return on asset ratio, the better the company’s profitability. The company will give positive signal to the investors and lead to the increasing of stock price Banchuenvijit [4].
Several studies have shown that stock price affected profitability. The statement above is according to the findings of a research study by Avdalovic [7] which identified that return on assets positively affects stock price (Figure 3).
Figure 3: Theoretical Framework
The following hypotheses can be proposed based on these studies:
H1: Profitability has positive effect on the growth of stock price of the LQ45 companies listed on the Indonesia Stock Exchange from 2010-2019
The Relations Between Liquidity and Stock Price
The higher the current ratio, the higher the stock price of the company. It will give positive signal to the investors and lead to the increasing of stock price Banchuenvijit [4]. Several studies have shown that stock price affected liquidity. The statement above is according to the findings of a research study by Kohansal et al. [3] which identified that current ratio positively affects stock price.
The following hypotheses can be proposed based on these studies:
H2: Liquidity has positive effect on the growth of stock price of the LQ45 companies listed on the Indonesia Stock Exchange from 2010-2019
The Relations Between Solvability and Stock Price
Higher debt-to-equity ratios have a negative impact on a business's performance, because a greater debt-to-equity ratio suggests that the company's has higher interest expense which reduces investors' willingness to buy stock. On the other hand, the lower debt-to-equity ratio shows the better performance and the lower risk perceptions of investors and affects investor’ interest for buying the shares that lead to the increase of stock price Banchuenvijit [4].
The statement above is according to the findings of a research study by Kohansal et al. [3] which identified that the debt-equity ratio negatively affects the stock price.
The following hypotheses can be proposed based on these studies:
H3: Solvability has negative effect on the growth of stock price of the LQ45 companies listed in Indonesia Stock Exchange from 2010-2019
The Relations Between Profitability and Stock Price
The higher total asset turnover will make the company gets a higher profit. Total asset turnover is essential for managers and investors. Because, it will show the ability of the company to use the total asset efficiently. As a result, the higher the overall asset turnover ratio, the better the company's performance. It will give a good signal to investors, resulting in an increase of stock price Banchuenvijit [4].
The statement above is according to the findings of a study conducted by Yassinki the overall asset turnover ratio has a positive impact on the stock price, according to this study.
The following hypotheses can be proposed based on these studies:
H4: Activity ratio has positive effect on the growth of stock price of the LQ45 companies listed in Indonesia Stock Exchange from 2010-2019
MATERIALS AND METHODS
Sample and Population
The study's population consists of firms listed on the Indonesia Stock Exchange and included in the LQ-45 index from 2010 to 2019. Purposive sampling is used in this research by selecting sample data based on the criteria desired by the researcher. The purposive sampling is the technique of sampling using the specific types who can provide the desired information.
Data Collection Method
This research depends on secondary information. Secondary data, according to Sekaran and Bougie is data that already exists and does not require the researcher to collect it. Panel data, this study makes use of data from time series and cross-sections. The information used in this study was gathered from a variety of sources was collected indirectly from www.idx.co.id, which was published and cited. The information comes from the financial statements of LQ45 firms that were listed on the Indonesia Stock Exchange from 2010 to 2019.
Analysis Method
The data analysis technique employed in this research was general equation multiple linear regression. The goal of the analysis is to figure out which way the relationship between the independent and dependent variables is going, whether each independent variable is connected or not and to forecast whether the value of the dependent and independent variables has increased or decreased.
The following is the procedure for performing a multiple linear regression analysis:
(1)
Description:
Y = Stock price
β0 = Constants of regression equations
β1 – β4, = Constants of regression equations
X1 = Profitability
X2 = Liquidity
X3 = Solvability
X4 = Activity
Ɛ = Standard Error
Variable Operationalization
One dependent variable and four independent variables were used to operationalize the variables in this study:
Dependent Variable
Stock Prices
According to Subramanian, the stock price is the price of a single stock of a company's saleable equity shares. As a result, the stock price used in this study is the growth of the stock price as a proxy for the stock price:
P1 = Stcok price in the current years
P0 = Stock price in the next years
Independent Variable
Profitability
According to Gitman et al. [1] the profitability ratio assesses a business' ability to compare profits to sales, assets and the owner's investment. In this study, the return on asset ratio was employed to determine profitability. The return on assets formula is as follows:
Liquidity Ratio
According to Gitman et al. [1] a company's ability to satisfy short-term obligations is measured by its liquidity ratio. The ratios used to measure liquidity ratio is current ratio. The formula of current ratio can be seen below:
Solvability Ratio
According to Gitman et al. [1], The solvability ratio is a calculation that determines how well a company manages its debt. The debt equity ratio formula is shown below:
Activity Ratio
According to Gitman et al. [1] The activity ratio is a calculation that determines how well a company manages its assets. The formula of total asset turnover ratio can be seen below:
RESULTS AND DISCUSSION
Descriptive Statistics Result
The interval-scaled items were given descriptive statistics, which are statistics that are used to examine data by using maximum, minimum, averages, standard deviation and variance. The result of descriptive statistics result can be seen in the Table 5.
Based on the result of Table 5 the growth of stock price (Y) variable has an average 13975.20 with a maximum value of 83799.00 and a minimum value of 514.0000. it means the quality growth of stock price data is doesn’t distributed well, this is related to the reasons that the average value is less than the 16313.31 standard deviation.
The profitability ratio (X1) has an average of 0.230040 with a maximum value of profitability is 10.10000 and minimum value 0.010000. it means the profitability ratio doesn’t distributed well, this is related to the reasons that the mean value is less than the 0.827005 standard deviation.
The liquidity ratio (X2) has an average of 1.398400 with a maximum value of liquidity ratio is 6.150000 and minimum value of liquidity ratio is 0.110000. Because the average number is higher than the standard deviation of 1.273239, the liquidity ratio has a good data distribution.
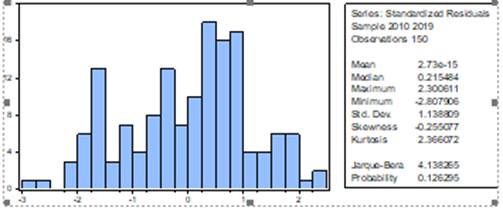
Figure 4: Classical Assumption Test
Source: Eviews Output Data (2021)
Table 5: Descriptive statistics result
Y
X1
X2
X3
X4
Mean
13975.20
0.230040
1.398400
2.003200
0.839673
Median
7849.000
0.135000
0.880000
0.790000
0.415000
Maximum
83799.00
10.10000
6.150000
8.430000
8.050000
Minimum
514.0000
0.010000
0.110000
0.020000
0.007000
Std. Dev.
16313.31
0.827005
1.273239
2.336086
1.267995
Observations
150
150
150
150
150
Source: Eviews Output Data (2021)
Table 6: Normality Test
X1
X2
X3
X4
X1
1.000000
0.107832
-0.129393
-0.039758
X2
0.107832
1.000000
-0.052560
-0.008731
X3
-0.129393
-0.052560
1.000000
-0.008812
X4
-0.039758
-0.008731
-0.008812
1.000000
Source: Eviews Output Data (2021)
Table 7: Heteroscedasticity Test
Variable
Coefficient
Std. Error
t-Statistic
Prob.
C
0.950928
0.169582
5.607455
0.0000
X1
-0.035023
0.033039
-1.060057
0.2909
X2
0.049451
0.032935
1.501485
0.1354
X3
-0. 052799
0.038753
-1.362460
0.1752
X4
0.006699
0.024661
0.271643
0.7863
Source: Eviews Output Data (2021)
Table 8: Autocorrelation Test
Durbin-Watson stat
1.860340
Source: Eviews Output Data (2021)
The solvability ratio (X3) has an average of 2.003200 with a maximum value of solvability ratio is 8.430000 and minimum value is 0.020000. It means solvability ratio doesn’t distributed well, this is related to the reasons that the mean value is less than the 2.336086 standard deviation.
The activity ratio (X4) has an average of 0.839673 with a maximum value is 8.050000 and minimum value is 0.007000. It means the activity ratio doesn’t distributed well, this is related to the reasons that the mean value is less than the 1.267995 standard deviation.
Classical Assumption Test
The value of Jarque-Bera is 4.138265, as shown in the Figure 4 with the probability value of 0.126295. So, it can be concluded that the data for measuring the growth of stock price in this study is normally distributed, because the probability is 0.126295>0.05, or in other words the assumption of normality is fulfilled.
Multicollinearity Test
Normality Test Result
The value of independent variables implies that the value of each variable is not more than 0.90 or 0.90, as shown in the Table 6. The results of this test show that there is no multicollinearity in this research.
Heteroscedasticity Test
The result of heteroscedasticity in Table 7 reveals that there is no problem with heterosdetasticity in this study when utilizing the random effect model. The probability value of each independent variable, which is more than 0.05, indicates that according to this test, there is also no heteroscedasticity in this research result.
Autocorrelation Test
According to Table 8, the Durbin Watson value is 1.860340, indicating that no autocorrelation exists in this research. The following is an explanation of the data dU DW 4-dU or 1.7802 1.860340 2.2198.
Regression Analysis Test Result
The data analysis technique in using a random effect model, the effect of the independent factors of profitability, liquidity, solvability and activity on the dependent variable growth of stock price was investigated using multiple linear regression analysis.
Based on the Table 9 the research model is:
Growth of Stock Price = 9.239171 + 0.144996X1
-0.010958X2 - 0.124091X3
+ 0.046736 + e
The following phrase can be derived from the above equation:
The constant-coefficient (C) is 9.239171. If all of the independent variables are zero, the stock price value of 9.239171 will grow at the same rate.
Table 9: Regression Analysis Test
Dependent Variable: LOG (Y)
Method: Panel EGLS (Cross-section random effects)
Date: 02/03/22 Time: 12: 24
Sample: 2010 2019
Periods included: 10
Cross-sections included: 15
Total panel (balanced) observations: 150
Swamy and Arora estimator of component variances
White period standard errors and covariance (d.f. corrected)
Variable
Coefficient
Std. Error
t-Statistic
Prob.
C
9.239171
0.287641
32.12051
0.0000
LOG(X1)
0.144996
0.061917
2.341770
0.0206
LOG(X2)
-0.010958
0.067347
-0.162708
0.8710
LOG(X3)
-0.124091
0.076591
-1.620180
0.1074
X4
0.04736
0.016100
2.902877
0.0043
Weighted Statistics
R-squared
0.077329
Mean dependent var
1.158876
Adjusted R-squared
0.051876
S.D dependent var
0.405093
S.E. of regression
0.394445
Sum squared resid
22.56013
F-statistic
3.038120
Durbin-Watson stat
0.970231
Prob (F-statistic)
0.019313
Table 10: t-Statistical Test
Variable
Coefficient
Std. Error
t-Statistic
Prob.
C
9.239171
0.287641
32.12051
0.0000
LOG(X1)
0.144996
0.061917
2.341770
0.0206
LOG(X2)
-0.010958
0.067347
-0.162708
0.8710
LOG(X3)
-0.124091
0.076591
-1.620180
0.1074
X4
0.04736
0.016100
2.902877
0.0043
Source: Eviews Output Data (2021)
The profitability coefficient value is 0.144996 and indicating that a 1% increase in profitability as a result in a 14% increase in growth of stock price. If other variable values remain constant
The liquidity ratio value is -0.008761, indicating that a 1% decrease in liquidity will result in a 8% increase in growth of stock price and assuming the values of the other variables remain constant
The solvability value is -0.124091 and indicating that a 1% decrease in solvability will result in a 12% decrease in growth of stock price if other variables’ values remain constant
The activity ratio value is 0.046736 and indicating that a 1% increase in activity will result in a 4% increase in growth of stock price if other variables’ values remain constant
t-Statistical Test Result
The purpose of the t-test is to determine if the variable has a significant or partial influence, as indicated by the partial t. Table 10 shows the result of data processing based on stock price growth. The following is based on hypothesis testing results.
According to the Table 10, the profitability ratio (X1) has a positive and significant effect on growth of stock price, the liquidity ratio (X2) has a negative and not significant effect on growth of stock price, the solvability (X3) has a negative and not significant effect on growth stock price and the activity ratio (X4) has a positive and significant effect on growth of stock price, according to the Table 10.
F-Statistic Test Result
The F test is used to see if the parameters have a significant impact on the outcome. outcome. or not simultaneously, which can be seen from the simultaneous F. The result of the F-statistical test using the growth of stock price can be seen in Table 10 as follow.
Table 11: Hypothesis testing
F-statistic
3.038120
Prob (F-statistic)
0.019313
Table 12: Preceding equation
R-squared
0.077329
Adjusted R-squared
0.051876
Based on Table 11, the result of hypothesis testing are obtained with a significance (p) = 0.019313. By using α = 0,05 it can be concluded that profitability, liquidity, solvability and activity do simultaneously effect on the growth of stock price.
Coefficient Determination (R2)
Ghozali [8] uses the coefficient of determination (R2) to decide how much the model illustrates the variability of the dependent variable.
The (R2) value in the preceding equation is 0.020233, as seen in the Table 12. This means that the independent factors profitability, liquidity, solvability and activity can contribute for 7% of the increase in stock price, while the whole of 93% is explained by other variables.
Hypotheses Discussion
1st Hypotheses Testing
H1: Profitability ratio has positive effect on growth of stock price of LQ45 companies listed on Indonesia Stock Exchange from 2010-2019.
The results of Table 10 indicated that the significance level of the profitability ratio was 0.0206>0,05. With a coefficient value of 0.144996, which indicates a positive effect. It means H1 is accepted and the result shows that the profitability has a positive effect and significant on the growth of stock price.
Profitability has a considerable impact on stock price growth, according to the results of a recent study by Al Qaisi et al. [9], which found that return on asset has a positive and significant impact on growth of stock price.
2ndHypotheses Testing
H2: Liquidity ratio has positive effect on growth of stock price on LQ45 companies listed on Indonesia Stock Exchange from 2010-2019.
Based on the Table 10, the results showed that the significance level of the liquidity ratio was 0.8710<0,05. With a coefficient value of -0.010958 which indicates a negative effect. It means that H2 has been rejected and the findings indicate that the liquidity ratio has a negative but not statistically significant impact on stock price increases.
Based on the result above, not significant liquidity on growth of stock price may occur because the number of samples from the data is too small and the data collected do not support the hypothesis. Another reason the factor affecting liquidity ratio doesn’t influence growth of stock price is. The company's capability to pay debt with current assets is not effectively utilized and this result contradicts Ross's [6] signaling theory.
This is in line with the findings of the study by Lambogia et al. which show that the current report is negative effects on stock prices.
3rdHypothesis Testing
H3: Solvability ratio has negative effect on growth of stock price on LQ45 companies listed in Indonesia Stock Exchange from 2010-2019
The results of Table 10 revealed that the significant level was 0.1074>0,05. a coefficient value of -0.124091 indicates a negative influence. It means H3 is accepted and the result show solvability ratio has a accepted effect but, not significant on growth of stock price
Based on the result above, not significant solvability ratio on growth of stock price may occur because the number of samples from the data is too small and the data collected do not support the hypothesis.
This is accordance with research conducted by Wangarry. Sari, the debt-to-equity ratio has a negative impact on stock price, according to the study.
4thHypotheses Testing
H4: Activity ratio has positive effect on growth of stock price on LQ45 companies listed in Indonesia Stock Exchange from 2010-2019.
Based on Table 10, the results showed that the significance, the activity ratio was 0.00430.5, indicating a positive effect with a coefficient value of 0.046736.
It means H4 is accepted and the result show that the activity ratio has a positive and significant impact on stock price growth.
This is consistent with the findings of Sari, Putra et al. and Sriwahyuni et al. who found that the total asset turnover ratio has a favorable and substantial effect on stock price increase.
5th Hypotheses Testing
H5: Profitability, liquidity, solvability and activity have a simultaneous effect on growth of stock price of LQ45 companies listed in Indonesia Stock Exchange from 2010-2019.
Based on Table 10, F coefficient value is 3.038120 with the significant value 0.019313 no more than 0,05. So the independent variable profitability, liquidity, solvability and activity has a simultaneous effect on growth of stock price. It means H5 is accepted.
Research conducted by Nuraihan, Octaviani et al., Suharno and Harianto et al. which found that profitability, liquidity, solvability and activity do simultaneously effect of stock price.
CONCLUSION
The fundamental purpose of this research is to examine into the relationship between profitability, liquidity, solvability and activity at LQ45 businesses listed on the Indonesia Stock Exchange (IDX) from 2010 to 2019. The study discovered no results in terms of the relationship between its factors and their impact on growth stock price.
Conclusion:
The profitability ratio has a significant and positive impact on growth of stock price. The result of this study accepts H1, this implies that if the company's profitability increases, the stock price will increase as well. Therefore, profitability ratio can predict the growth of stock price
The liquidity ratio has a negative effect and not significant on growth of stock price. The results of this study rejects H2, this implies that if the liquidity increases, the stock price will decrease. As a result, the liquidity ratio is unable to forecast stock price increase
The solvability ratio has a negative impact and not significant on growth of stock price. The findings of this study rejects H3, this indicate that the solvability decrease, the stock price will decrease. This indicate, the investors do not consider the importance of solvability. As a result, the solvability ratio is unable to forecast the growth of stock price
The activity ratio has a significant positive impact on growth of stock price. The results of this study accepts H4, indicate that if the activity ratio increase, the growth of stock price will increase. Therefore, activity ratio can predict the growth of stock price
Profitability, liquidity, solvability and activity have a simultaneous effect on growth of stock price. The findings of this research accepts H5. Therefore profitability, liquidity, solvability and activity can predict the growth of stock price
Suggestions:
For the companies, profitability and activity has a positive significant impact on growth of stock price. As a result, the company is expected to put greater priority on the profitability and activity ratios
For the investors, the findings of this research are intended to provide an overview for shareholders. Investors can utilize the information from this study's findings to help them in making stock purchase decisions. The investors may consider other ratios to decide investment decision
For academics and further research, the author anticipates that this study will develop by adding various variables that influence the growth of stock price and also using other company entities types to increase the population of companies that will be used as the research samples
REFERENCES
Gitman, L.J. et al.Principles of managerial finance. Pearson Higher Education AU, 2015.
Dadrasmoghadam, Amir and Seyed MohammadReza Akbari. "Relationship between financial ratios in the stock prices of agriculture-related companies accepted on the stock exchange of Iran." Research Journal of Fisheries and Hydrobiology, vol. 10, no. 9, 2015, pp. 586–591.
Kohansal, M.R. et al. "Relationship between financial ratios and stock prices for the food industry firms in stock exchange of Iran." World Applied Programming, vol. 3, 2013.
Banchuenvijit, W. "Financial ratios and stock prices: Evidence from the agriculture firms listed on the stock exchange of Thailand." International Journal of Business and Economics, vol. 8, no. 1, 2016, pp. 21–29.
Brigham, E.F. and J.F. Houston. Fundamentals of financial management. 2016.
Ross, S.A. "The determination of financial structure: The incentive-signalling approach." Bell Journal of Economics, vol. 8, 1977, pp. 23–40.
Avdalovic, S.M. and I. Milenković. "Impact of company performances on the stock price: An empirical analysis on select companies in Serbia." Economics of Agriculture, vol. 64, no. 2, 2017, pp. 561–570.
Ghozali, Imam. Aplikasi analisis multivariat dengan program IBM SPSS 23. Edisi 8, Universitas Diponegoro, 2016.
Al Qaisi, F. et al. "Factors affecting the market stock price: The case of the insurance companies listed in Amman Stock Exchange." International Journal of Business and Social Science, vol. 7, no. 10, 2016, pp. 81–90.
Lambogia, A.J.G., C. Vista and S. Dini. "Pengaruh current ratio, debt to equity ratio, net profit margin, dan ukuran perusahaan terhadap harga saham pada perusahaan otomotif dan komponen yang terdaftar di BEI tahun 2013-2017." Jesya (Jurnal Ekonomi & Ekonomi Syariah), vol. 3, no. 1, 2020, pp. 158–173, https://doi.org/10.36778/jesya.v3i1.138.
License
Creative Commons Attribution-NonCommercial-NoDerivatives 4.0 International License
All papers should be submitted electronically. All submitted manuscripts must be original work that is not under submission at another journal or under consideration for publication in another form, such as a monograph or chapter of a book. Authors of submitted papers are obligated not to submit their paper for publication elsewhere until an editorial decision is rendered on their submission. Further, authors of accepted papers are prohibited from publishing the results in other publications that appear before the paper is published in the Journal unless they receive approval for doing so from the Editor-In-Chief.
Himalayan Journal of Economics and Business Management open access articles are licensed under a Creative Commons Attribution-Share A like 4.0 International License. This license lets the audience to give appropriate credit, provide a link to the license, and indicate if changes were made and if they remix, transform, or build upon the material, they must distribute contributions under the same license as the original.
Advertisement
Recommended Articles
Research Article
The impact of organizational flexibility on improving institutional performance in Iraqi business organizations
Muntaha Abdul Hassan Salih
Published: 22/01/2026
Download PDF
Cite
x
APA
Salih, M. A. H. (2026). The impact of organizational flexibility on improving institutional performance in Iraqi business organizations. Himalayan Journal of Economics and Business Management, 7(1), 1-9.
MLA
Salih, Muntaha A. H.. "The impact of organizational flexibility on improving institutional performance in Iraqi business organizations." Himalayan Journal of Economics and Business Management 7.1 (2026): 1-9.
Chicago
Salih, Muntaha A. H.. "The impact of organizational flexibility on improving institutional performance in Iraqi business organizations." Himalayan Journal of Economics and Business Management 7, no. 1 (2026): 1-9.
Harvard
Salih, M. A. H. (2026) 'The impact of organizational flexibility on improving institutional performance in Iraqi business organizations' Himalayan Journal of Economics and Business Management 7(1), pp. 1-9.
Vancouver
Salih MAH. The impact of organizational flexibility on improving institutional performance in Iraqi business organizations. Himalayan Journal of Economics and Business Management. 2026 Jan;7(1):1-9.
Download PDF
Research Article
Influence of Leadership on Poverty Reduction in the Devolved Government in Trans-Nzoia County, Kenya
Kinisu Sifuna,
...
Peter Simotwo
Published: 30/06/2021
Download PDF
Cite
x
APA
Sifuna, K., Lwangale, D. W., Simotwo, P., Sifuna, K., Lwangale, D. W. & Simotwo, P. (2021). Influence of Leadership on Poverty Reduction in the Devolved Government in Trans-Nzoia County, Kenya. Himalayan Journal of Economics and Business Management, 2(1), None-None.
MLA
Sifuna, Kinisu, et al. "Influence of Leadership on Poverty Reduction in the Devolved Government in Trans-Nzoia County, Kenya." Himalayan Journal of Economics and Business Management 2.1 (2021): None-None.
Chicago
Sifuna, Kinisu, David W. Lwangale, Peter Simotwo, Kinisu Sifuna, David W. Lwangale and Peter Simotwo. "Influence of Leadership on Poverty Reduction in the Devolved Government in Trans-Nzoia County, Kenya." Himalayan Journal of Economics and Business Management 2, no. 1 (2021): None-None.
Harvard
Sifuna, K., Lwangale, D. W., Simotwo, P., Sifuna, K., Lwangale, D. W. and Simotwo, P. (2021) 'Influence of Leadership on Poverty Reduction in the Devolved Government in Trans-Nzoia County, Kenya' Himalayan Journal of Economics and Business Management 2(1), pp. None-None.
Vancouver
Sifuna K, Lwangale DW, Simotwo P, Sifuna K, Lwangale DW, Simotwo P. Influence of Leadership on Poverty Reduction in the Devolved Government in Trans-Nzoia County, Kenya. Himalayan Journal of Economics and Business Management. 2021 Jan;2(1):None-None.
Download PDF
Research Article
Modelling Structure Job Quality, Job Design and Job Satisfaction
Moch Nurhadi,
...
Avi Sunani
Published: 30/08/2022
Download PDF
Cite
x
APA
Nurhadi, M., Bisyri Effendi, M., Saiful Ulum, A. & Sunani, A. (2022). Modelling Structure Job Quality, Job Design and Job Satisfaction. Himalayan Journal of Economics and Business Management, 3(2), 1-4.
MLA
Nurhadi, Moch, et al. "Modelling Structure Job Quality, Job Design and Job Satisfaction." Himalayan Journal of Economics and Business Management 3.2 (2022): 1-4.
Chicago
Nurhadi, Moch, Moch Bisyri Effendi, Achmad Saiful Ulum and Avi Sunani. "Modelling Structure Job Quality, Job Design and Job Satisfaction." Himalayan Journal of Economics and Business Management 3, no. 2 (2022): 1-4.
Harvard
Nurhadi, M., Bisyri Effendi, M., Saiful Ulum, A. and Sunani, A. (2022) 'Modelling Structure Job Quality, Job Design and Job Satisfaction' Himalayan Journal of Economics and Business Management 3(2), pp. 1-4.
Vancouver
Nurhadi M, Bisyri Effendi M, Saiful Ulum A, Sunani A. Modelling Structure Job Quality, Job Design and Job Satisfaction. Himalayan Journal of Economics and Business Management. 2022 Jul;3(2):1-4.
Download PDF
Research Article
Accountability and Transparency of Village Fund Management in Lumajang District
Nurina Ayuningtiyas,
...
Muhammad Miqdad
Published: 28/12/2023
Download PDF
Cite
x
APA
Ayuningtiyas, N., Santosa Putra, H. & Miqdad, M. (2023). Accountability and Transparency of Village Fund Management in Lumajang District. Himalayan Journal of Economics and Business Management, 4(2), 1-4.
MLA
Ayuningtiyas, Nurina, Hendrawan Santosa Putra and Muhammad Miqdad. "Accountability and Transparency of Village Fund Management in Lumajang District." Himalayan Journal of Economics and Business Management 4.2 (2023): 1-4.
Chicago
Ayuningtiyas, Nurina, Hendrawan Santosa Putra and Muhammad Miqdad. "Accountability and Transparency of Village Fund Management in Lumajang District." Himalayan Journal of Economics and Business Management 4, no. 2 (2023): 1-4.
Harvard
Ayuningtiyas, N., Santosa Putra, H. and Miqdad, M. (2023) 'Accountability and Transparency of Village Fund Management in Lumajang District' Himalayan Journal of Economics and Business Management 4(2), pp. 1-4.
Vancouver
Ayuningtiyas N, Santosa Putra H, Miqdad M. Accountability and Transparency of Village Fund Management in Lumajang District. Himalayan Journal of Economics and Business Management. 2023 Jul;4(2):1-4.
Alfitra, D. & Anwar, F. (2022). Financial Performance and Stock Prices in Indonesia: An Empirical Study of the Relationship between Financial Ratios and Stock Prices. Himalayan Journal of Economics and Business Management, 3(1), 1-9.
MLA
Alfitra, Delsa and Fathurrahman Anwar. "Financial Performance and Stock Prices in Indonesia: An Empirical Study of the Relationship between Financial Ratios and Stock Prices." Himalayan Journal of Economics and Business Management 3.1 (2022): 1-9.
Chicago
Alfitra, Delsa and Fathurrahman Anwar. "Financial Performance and Stock Prices in Indonesia: An Empirical Study of the Relationship between Financial Ratios and Stock Prices." Himalayan Journal of Economics and Business Management 3, no. 1 (2022): 1-9.
Harvard
Alfitra, D. and Anwar, F. (2022) 'Financial Performance and Stock Prices in Indonesia: An Empirical Study of the Relationship between Financial Ratios and Stock Prices' Himalayan Journal of Economics and Business Management 3(1), pp. 1-9.
Vancouver
Alfitra D, Anwar F. Financial Performance and Stock Prices in Indonesia: An Empirical Study of the Relationship between Financial Ratios and Stock Prices. Himalayan Journal of Economics and Business Management. 2022 Jan;3(1):1-9.