Contents
Download PDF
pdf Download XML
1146 Views
192 Downloads
Share this article
Advertisement
Review Article | Volume 3 Issue 2 (July-Dec, 2022) | Pages 1 - 7
Analysis of Internal Factors Affecting Company Value in Indonesia
 ,
1
Perbanas Institute, Indonesia
Under a Creative Commons license
Open Access
Received
Aug. 15, 2022
Revised
Sept. 10, 2022
Accepted
Oct. 15, 2022
Published
Oct. 30, 2022
Abstract

The value of the company can reflect the performance of a company because it can affect the perception of investors towards the company. The purpose of this study was to obtain empirical evidence of internal factors that affect the firm value. Internal factors include profitability, debt policy, growth and firm size. This study investigates the relevance of firm value in companies listed as LQ45 stocks in the Indonesia Stock Exchange for the period 2018–2020. Data were collected from 11 companies that met the predetermined sample criteria. The results of this study empirically prove that profitability does not affect firm value. Debt policy, growth and firm size have a significant effect on firm value.

Keywords
INTRODUCTION

The company plays a very important role in the development of a country. Any company is oriented towards achieving maximum profit to increase the value of the company. Until now, the company's value is used as a reference for public trust in the performance that has been carried out and achieved by the company since the company was founded [1]. With a high company value, the market will believe in the company's performance and prospects in the future so that it can attract many investors to want to invest [2]. Every investor who invests in it wants a high company value because it can provide prosperity for shareholders [1]. Investors will also be more interested in investing because, with a high company value, the rate of return on investment will also be high. Currently, investment is one of the attractive activities that can benefit economic actors. Investment activities are related to the profits that will be obtained by the company. The value of the company is determined by investment decisions. It is through investment activities that the company can achieve its company goals so investment decisions are a very important part. Some of the factors that affect the value of the company include profitability, debt policy, company growth and company size.


Profitability can measure the company's ability to generate profits and can measure the level of operational efficiency in using the company's assets [2]. A good company's prospects can be described by high net profit so that investors will be more interested in buying shares so that the value of the company will also be higher. In this study, the company's profitability can be measured by the Return On Equity (ROE) ratio because ROE can show the company's ability to manage equity and generate a net profit. 


Debt policy is a policy taken by a company to carry out its operations by utilizing debt [3]. Debt policy in this study was measured using DER (debt to equity ratio). DER can measure how far a company finances its operations with debt, the higher the value of the DER ratio, the worse there are symptoms in the company.


Company growth (growth) is described by an increase or decrease in the total assets owned by the company. The company's growth is calculated using the percentage change in assets each year [4]. In this study, Growth is measured by Sales Growth (sales growth). Sales growth can show the extent to which companies can improve their sales capabilities continuously.


Firm size describes the size of a company which can be indicated by total assets, number of sales, average total sales and average total assets Marista [5]. Firm size in this study is measured by total assets that can reflect the size of the company which is seen in the total value of the company's assets.


Several studies have been conducted to look at internal factors that affect the value of the company but the results are still inconsistent. Therefore, researchers are interested in conducting re-research on internal factors that affect the value of companies listed on the Indonesia Stock Exchange as LQ-45 shares for the 2018-2020 period. The internal factors in this study consist of profitability, debt policy, company growth and company size.


Literature Review and Hypothesis

Signaling Theory

Signal theory can provide company signals to users of financial statements, namely investors. The signal is in the form of a statement taken by management regarding the condition of the company's prospects [6]. This signal theory can explain why a company must provide its financial statement data to external parties in this case it is an investor or potential investor. The importance of providing information to external parties is because it is the company's internals who are more aware of the company's condition and prospects. As for external parties, this kind of information is needed to be analyzed before they invest in the company.


Company Values

The value of the company for investors can be reflected in its share price, with a high stock price, the value of the company is also high. If the company can maximize its value of the company, the shareholders in it will also prosper by the main objectives of each company. The prosperity of shareholders and companies is represented by the share price. A high share price indicates that the company's value is in good condition with many investment opportunities for the company's growth in the future.


Profitability

The profitability ratio can measure the level of effectiveness of management in carrying out company operations through sales activities, the use of assets and the use of capital to generate maximum profit for the company [7]. For enterprises, the profit is used for the payment of interest and principal on loans. Meanwhile, for investors or potential investors, profit is one of the determining factors for changes in stock values. But the important thing for the company is how the profit can maximize the prosperity of shareholders with the amount of profit generated by the company [8].


Debt Policy

Debt policy is one of the funding alternatives for companies other than selling shares in the capital market. The debt owed by the company becomes an instrument that is quite sensitive to changes in the value of the company. If the use of debt generates more profit than the costs incurred due to debt, it can increase investor confidence in the company's future capabilities which directly impacts the value of the company. However, an increase in debt can also reduce the value of the company if the benefits obtained from the use of debt are smaller than the costs incurred by debt.


Company Growth (Growth)

The increase or decrease in total assets owned by the company is seen through the growth of its company (growth). 


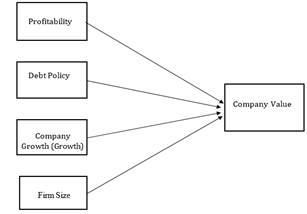
Figure 1: Research Model


The company's growth can be seen from the percentage change in assets every year [4]. The higher the company's growth, the greater the need for funds needed by the company for business expansion activities. According to Kasmir [9], the growth ratio explains the company's ability to maintain its company's ability in the midst of the current global economy. The company's growth ratios are used to see the ability of management to utilize all its resources.


Firm Size

According to Hilmi and Ali [10], the size of a company is a value that indicates the size of a company. The size of the company can be analyzed based on the total value of assets, total sales, market capitalization, number of workers and so on. To analyze the size of the company the researcher uses the total assets as an indicator of the independent variable of the size of the company. Total assets are more suitable for showing the size of the company because the total value of assets is more stable and representative than the value of market capitalization and sales which are generally influenced by supply and demand.


Hypotheses and Research Models

This study aims to see whether there is an influence of independent variables, namely profitability, debt policy, company growth and company value on dependent variables, namely company value. The hypotheses proposed in this study are (Figure 1):


H1:  Profitability has a significant effect on the value of the company

H2:  Debt policy has a significant effect on the value of the company

H3:  The growth of the company has a significant effect on its value of the company

H4:  The size of the company has a significant effect on the value of the company

MATERIALS AND METHODS

The research data was obtained from the Indonesia Stock Exchange website www.idx.co.id in the form of financial statements that have been audited and published during the 2018-2020 period. The population in this study used companies listed in LQ45 shares on the Indonesia Stock Exchange (IDX) for the 2018-2020 period. In this study, the purposive sampling method was used to determine the research sample. The criteria used in purposive sampling are as follows (Table 1):


  • The company that issued its financial statements for the period ended December 31 during the observation period, in this case the period 2018-2020. Perusahaan yang berturut-turut masuk dalam indeks LQ45 sejak tahun 2018-2020

  • Companies that have complete data and according to the calculation process in this study

  • Financial statements are denominated in rupiah

  • There is the completeness of data needed in this study


Data Analysis Methods

In general, the research model proposed in this study is as follows:


Y = α + β1ROE + β2DER + β3Growth + β4Size + e


Information:

Y              =  Price to Book Value (PBV)

α             =  constanta

β              =  Independent variable regression coefficient

ROE        =  return to equity ratio

DER        =  debt to equity ratio

Growth  =  sales growth

Size         =  firm size

e              =  error


Descriptive Statistics

Descriptive statistics contain information from the data interpreted in the form of a summary in the form of the lowest value (minimum), the highest value (maximum), the average value (mean) and the standard deviation of each variable used in this study (Table 2).


Classic Assumption Test

The classical assumption test explains whether or not a panel data regression model is appropriate if used to perform the estimation. The panel data regression model can be said to be good if it has met the requirements called Best Linear Unbiased Estimator (BLUE), which is that it has met the classical assumption consisting of avoiding symptoms of multicollinearity, heteroskedasticity and linearity tests.


Panel Data Regression Analysis

According to Widarjono, there are three estimates for the panel data model, namely:


  • Common Effect Model
  • Fixed Effect Model
  • Random Effect Model


Selection of Panel Data Estimation Techniques

To choose the most appropriate model used in managing panel data, 3 tests must be carried out, namely the Chow Test, Hausman Test and Lagrange Multiplier Test. The Chow test was performed to compare the results of the common effect model with the fixed effect. The Hausman test was conducted to compare whether using a fixed effect or random effect model. The Lagrange Multiplier test is carried out to find out whether the random effect model or the most appropriate common effect model is used.


Hypothesis Testing

Hypothesis tests were performed to see if the panel data regression coefficient could provide influential and significant results. Significant here is interpreted to mean that the value of the regression coefficient is statistically not equal to zero. Hypothesis testing of this study includes a t-test and a coefficient of determination test.

RESULTS

Descriptive Statistics

Classic Assumption Test Result

Normality Test

Looking at the normality test results in Figure 2, the normal distributed residual value with a probability value of 0.573717>0.05.


Multicollinearity Test

Based on the multicollinearity test in Table 3 each independent variable has a VIF value of <10, the regression model is not exposed to multicollinearity.


Table 1:  Variable Measurement

Variable

Definisi Variable

Variable Measurement


Price To Book Value (PBV)               

Comparison between the market value per share outstanding and the book value of the shares

company.

Return On Equity (ROE)


Describes the rate of return based on

company equity.


Debt To Equity Ratio

(DER)

the ratio between total debt to total equity


Sales Growth (Growth)

Describing achievements

sales growth from year to year.


Firm Size (Size)

The value that indicates the size of a company is based on the total value of the asset.


Table 2: Descriptive Statistics


PBV

ROE

DER

Pertumbuhan

Ukuran

Mean

3.80389

0.19385

2.27758

0.038667

32.0458

Median

Maximum

Minimum

Std. Dev.

Skewness

Kurtosis

Jarque Bera

Probability

Sum

Sum Sq. Dev.

Observations

1.90967

56.7919

0.56716

7.02657                                        

6.40423

48.3500

6384.46                                        

0.00000

262.468

3357.34

69

0.13977

1.45088

0.00877

0.26381

3.87475

17.7936

801.856

0.00000

13.3762

4.73253

69

0.88663

16.0785

0.18644

2.99640

2.37918

9.46027

185.084

0.00000

157.153

610.534

69

0.044207

0.994786

-0.392333

0.195450

1.474122

10.32192

179.1201

0.000000

2.668054

2.597644

69

31.7113

34.8959

29.5165

1.55849

0.39892

2.16246

3.84680

0.14610

2211.16

165.166

69

Sumber: Hasil pengolahan data dengan Eviews 10


Table 3: Multicollinearity Test

Variance Inflation Factors

Sample: 69

Included observations: 69


Coefficient

Uncentered

Centered

Variable

Variance

VIF

VIF

C

55.84281

11510.09

NA

PROFITABILITAS

0.007914

8.408467

1.371756

KEBIJAKAN HUTANG

0.008204

2.229968

2.189004

PERTUMBUHAN PERUSAHAAN

0.002504

2.770293

1.335736

UKURAN PERUSAHAAN

4.693258

11623.30

2.220276

Source: Data processing results with Eviews 10


Figure 1.2: Normality Test. Source: Data processing results with Eviews 10


Heteroskedasticity Test

In Table 4 of the heteroskedasticity test, the probability value >0.05, it can be concluded that the regression model is not exposed to heteroskedasticity.


Panel Data Regression Model Testing

To obtain the right panel data regression technique, a chow test will be carried out, the results of this chow test will be used to determine whether this study is more suitable using common effects or fixed effects (Table 5).


The values of Cross-Section F and Cross-Section Chi-square have values below 0.05, namely 0.0000, then accept Ha and rejected H0 so it is then necessary to conduct a Hausman test to determine whether using the Random Effect or Fixed Effect model.


Based on the results of the Hausman Test in Table 6, it can be seen that the Probability value has a value below 0.05, namely 0.0000 so it is concluded that the Random Effect (H0) model is rejected and the Fixed Effect (Ha) model is accepted, so this study is more suitable using the Fixed Effect method.


Model Regresi Data Panel

With the testing of the panel data regression model through the chow test and the Hausman test, it was obtained that the panel data regression model suitable for this study is the Fixed Effect panel data regression model. The following are the results of the processing carried out with the Eviews 10 software.


Three independent variables whose Probability value< 0.05, namely debt policy, company growth and company size have a significant effect on the value of the company. While the independent variable of profitability with Probability >0.05 does not affect the value of the company.


The panel data regression model suitable for this study is to use the Fixed Effect panel data regression model that has been shown in Table 7 so that the regression equation model for the Fixed Effect Model is as follows:


Company Value: 1422216 + 0.008360*Profitability + 0.709460*Debt Policy – 0.079937* Growth– 40.85896* Firm Size.


Table 4: Heteroskedasticity Test

Heteroskedasticity Test: Glejser


F-statistic

1.245833

Prob. F(4,64)


0.3006

Obs*R-squared

4.984536

Prob. Chi-Square(4)


0.2889

Scaled explained SS

3.739436

Prob. Chi-Square(4)


0.4424

Dependent Variable: ARESID


Method: Least Squares


Sample:   69


Included observations: 69


Variable

Coefficient

Std. Error

t-Statistic

Prob.

C

6.157307

3.902181

1.577914

0.1195

PROFITABILITAS

-0.024515

0.046455

-0.527714

0.5995

KEBIJAKAN HUTANG

0.068189

0.047296

1.441742

0.1543

PERTUMBUHAN PERUSAHAAN

-0.042561

0.026129

-1.628910

0.1082

UKURAN PERUSAHAAN

-1.679613

1.131256

-1.484732

0.1425

R-squared

0.072240

Mean dependent var

0.468236

Adjusted R-squared

0.014255

S.D. dependent var

0.304306

S.E. of regression

0.302129

Akaike info criterion

0.513780

Sum squared resid

5.842048

Schwarz criterion

0.675671

Log-likelihood

-12.72539

Hannan-Quinn criter.

0.578007

F-statistic

1.245833

Durbin-Watson stat

1.754146

Prob(F-statistic)

0.300603


Source: Data processing results with Eviews 10


Table 5: Chow Test

Redundant Fixed Effects Tests Equation: Untitled

Test cross-section fixed effects

Effects Test

Statistic

d.f.

Prob.

Cross-section F

11.503105

(22,42)

0.0000

Cross-section Chi-square

134.518070

22

0.0000

 Source: Data processing results with Eviews 10


Table 6: Uji Hausman

Correlated Random Effects - Hausman Test Equation: Untitled

Test cross-section random effects

Test Summary

Chi-Sq. Statistic

Chi-Sq. d.f.

Prob.

Cross-section random

56.978563

4

0.0000

Source: Data processing results with Eviews 10


Table 7: Fixed Effect Panel Data Regression

Dependent Variable: PBV

Method: Panel Least Squares Sample: 2018 2020

Periods included: 3

Cross-sections included: 23

Total panel (balanced) observations: 69

Variable

Coefficient

Std. Error

t-Statistic

Prob.

Profitabilitas

0.008360

0.069253

0.120710

0.9045

Kebijakan Hutang

0.709460

0.189191

3.749964

0.0005

Pertumbuhan Perusahaan

-0.0799370.034493-2.3175020.0254

Size

-40.85896

9.395426

-4.348814

0.0001

C   

1422216.

325188.4   

4.373513

0.0001

Effects Specification

Cross-section fixed (dummy variables)

R-squared

0.940834

Mean dependent var

8302.290


Adjusted R-squared

0.904207

S.D. dependent var

8706.138


S.E. of regression

2694.589

Akaike info criterion

18.92205


Sum squared resid

3.05E+08

Schwarz criterion

19.79627


Log-likelihood

-625.8108

Hannan-Quinn criter.

19.26888


F-statistic

25.68706

Durbin-Watson stat

2.196292


Prob(F-statistic)

0.000000


Source: Data processing results with Eviews 10


Hypothesis Testing and Coefficient of Determination

In Table 8, you can see the adjusted value of r square of 0.904207 or 90.42%. Then it can be known that the independent variables of profitability (X1), debt policy (X2), company growth (X3) and company size (X4) influence the value of the company by 90.42% while the remaining 9.58% is explained by other independent variables that are not in this study.

DISCUSSION

The Effect of Profitability on Company Value

The results of hypothesis testing show that profitability does not affect the value of the enterprise. This result is not in line with research conducted by Rizka and Mahendra research which states that profitability proxied with ROE has a significant positive influence on the value of the company. Currently, investors' views are not only centered on the profitability value of a company, which means that low or high ROE values are not too much of a reference for investors to assess a company's performance. Because currently, many investors are more concerned about other fundamental variables such as the value of Earnings Per Share (EPS) which according to investors feel more impact when they invest their capital, namely based on the Earnings that investors will get.


Table 8: Partial Test (T-Test) and Coefficient of Determination

Dependent Variable: PBV 

Method: Panel Least Squares Sample: 2018 2020

Periods included: 3

Cross-sections included: 23

Total panel (balanced) observations: 69

VariableCoefficient                          Std. Errort-StatisticProb.
PROFITABILITAS                                                                     0.0083600.0692530.1207100.9045
KEBIJAKAN HUTANG0.7094600.1891913.7499640.0005
PERTUMBUHAN PERUSAHAAN-0.0799370.034493-2.3175020.0254
SIZE-40.858969.395426-4.3488140.0001
C                                                                                          1422216.325188.44.3735130.0001

Effects Specification

Cross-section fixed (dummy variables)

R-squared0.940834Mean dependent var8302.290 
Adjusted R-squared0.904207S.D. dependent var8706.138 
S.E. of regression2694.589Akaike info criterion18.92205 
Sum squared resid3.05E+08Schwarz criterion19.79627 
Log-likelihood-625.8108Hannan-Quinn criter.19.26888 
F-statistic25.68706Durbin-Watson stat2.196292 
Prob(F-statistic)0.000000   

Source: Data processing results with Eviews 10


The Effect of Debt Policy on Company Value

The results of hypothesis testing show that debt policy affects the value of the company. This result is in line with research conducted by Ade Pratiwi Indasari [11], research by Rizqia et al. and research by Afzal and Rohman. The company's debt policy can also be responded to positively by investors if the benefits obtained from the debt are greater than the costs incurred from the debt. This means that the company can pay its obligations in the future [3]. So that the policy of increasing debt will be able to increase the value of the company.


The Effect of Company Growth on Company Value

The results of hypothesis testing show that the growth of the company has a significant effect on its value of the company. If the growth rate of sales of an enterprise continues to increase, the higher the costs required for investment activities will be. A company with high sales growth indicates that a company is developing well. The profit earned by the company from its business processes has time to be reinvested into the company as retained earnings and there is also time to be distributed to shareholders in the form of dividends. The amount of this dividend can affect the stock price. If the dividend given is high, the stock price will be high so that the value of the company is also high.


The Effect of Company Size on Company Value

The results of hypothesis testing show that the size of the company has a significant effect on its value of the company. This research is in line with research conducted by Gill and Obradovich and Rizka. Total assets as a company size can give investors and potential investors confidence in the company's ability to manage the company's business so that the size of the company affects the value of the company. Maryam, stated that the size of a company can be interpreted as the size of a company which is seen from the magnitude of the total value of assets of a company. Large companies will have easier access to the capital market so that companies can obtain greater funding for their investment activities.

CONCLUSION

Based on the results of research analysis and discussion of internal factors that affect the value of the company, it can be concluded as follows:


  • Profitability does not affect the value of the company 

  • Debt policy has a significant effect on the value of the company 

  • The growth of the company has a significant effect on the value of the company 

  • The size of the company has a significant effect on the value of the company


Recommendation

Based on several recommendations that can be considered for subsequent researchers, including:


  • Researchers can then extend the research period so that the results obtained are more relevant in addition to that so that the research becomes wider and better and is expected to involve other sectors besides LQ45

  • Researchers can further add other variables that are thought to affect the value of the company such as Dividend Policy, Interest Rate and other fundamental factors of the company


It is hoped that the next study, can consider variables that affect the value of the company in this study.

REFERENCES
  1. Denziana, Angrita, W.M. "Analisis ukuran perusahaan dan profitabilitas terhadap nilai perusahaan (studi empiris pada perusahaan yang tergolong LQ45 di BEI periode 2011–2014)." Jurnal Akuntansi & Keuangan, vol. 7, no. 2, 2016, pp. 241–254.

  2. Hermuningsih, S. "Pengaruh profitabilitas, growth opportunity, struktur modal terhadap nilai perusahaan publik di Indonesia." Buletin Ekonomi Moneter dan Perbankan, 2013, pp. 128–145.

  3. Brigham, E.F. Dasar-dasar manajemen keuangan. Edisi 10, Salemba Empat, Jakarta, 2011.

  4. Suprantiningrum. "Pengaruh pertumbuhan aktiva dan ukuran perusahaan terhadap struktur modal pada perusahaan perbankan." Jurnal Ilmiah Dinamika dan Bisnis, 2013, pp. 32–43.

  5. Oktaviani, Marista, A.R. "Pengaruh ukuran perusahaan (size) dan struktur modal terhadap nilai perusahaan." Jurnal Balance, 2019, pp. 102–105.

  6. Prapaska, J.R. "Analisis pengaruh tingkat profitabilitas, keputusan investasi, keputusan pendanaan dan kebijakan dividen terhadap nilai perusahaan manufaktur di BEI tahun 2009–2010." *Kertas Kerja Universitas Diponegoro

  7. Hery. Akuntansi aset, liabilitas, dan ekuitas. PT Grasindo, Jakarta, 2016.

  8. Ayu, D. "Pengaruh struktur modal, profitabilitas, dan ukuran perusahaan pada nilai perusahaan." Jurnal Akuntansi Universitas Udayana, 2013.

  9. Kasmir. Analisis laporan keuangan. PT Raja Grafindo Persada, Jakarta, 2012.

  10. Hilmi, U. "Analisis faktor-faktor yang mempengaruhi ketepatan waktu penyampaian laporan keuangan (studi empiris pada perusahaan-perusahaan yang terdaftar di BEJ periode 2004–2006)." Jurnal Akuntansi Keuangan, 2008.

  11. Indasari, Ade Pratiwi, I.K. "Pengaruh profitabilitas, growth opportunity, likuiditas, dan struktur modal pada nilai perusahaan." E-Jurnal Akuntansi Universitas Udayana, 2018, pp. 714–746.

Advertisement
Recommended Articles
Research Article
Modelling Structure Job Quality, Job Design and Job Satisfaction
...
Published: 30/08/2022
Download PDF
Research Article
Accountability and Transparency of Village Fund Management in Lumajang District
...
Published: 28/12/2023
Download PDF
Review Article
An Analytical Approach on the Application of Blockchain Technology in Fiscal and Monetary Policy-China Case Review
...
Published: 10/06/2025
Download PDF
Research Article
The Influence of Managerial Ownership and Institutional Ownership on Manufacturing Company Value with Corporate Social Responsibility (CSR) as a Moderating Variable
...
Published: 01/06/2025
Download PDF
Chat on WhatsApp
Flowbite Logo
Najmal Complex,
Opposite Farwaniya,
Kuwait.
Email: kuwait@iarcon.org

Editorial Office:
J.L Bhavan, Near Radison Blu Hotel,
Jalukbari, Guwahati-India
Useful Links
Order Hard Copy
Privacy policy
Terms and Conditions
Refund Policy
Others
About Us
Contact Us
Online Payments
Join as Editor
Join as Reviewer
Subscribe to our Newsletter
Follow us
MOST SEARCHED KEYWORDS
scientific journal
 | 
business journal
 | 
medical journals
 | 
Scientific Journals
 | 
Academic Publisher
 | 
Peer-reviewed Journals
 | 
Open Access Journals
 | 
Impact Factor
 | 
Indexing Services
 | 
Journal Citation Reports
 | 
Publication Process
 | 
Impact factor of journals
 | 
Finding reputable journals for publication
 | 
Submitting a manuscript for publication
 | 
Copyright and licensing of published papers
 | 
Writing an abstract for a research paper
 | 
Manuscript formatting guidelines
 | 
Promoting published research
 | 
Publication in high-impact journals
Copyright © iARCON Internaltional LLP . All Rights Reserved.