Improving employee performance is the hope of employers and the community as service recipients. Employers want all employees to have good performance and employees who have an interest in self-development and job promotion. Community satisfaction describes a service provided to the community that will affect the quality of service. This study aims to analyze the effect of the quality of human resources and service quality on employee performance with community satisfaction as an intervention variable. The population in this study were people who received services at the Disdukcapil Office of Pemalang Regency, totaling 240 people consisting of 130 people who were male and 110 people who were female. The sample in this study amounted to 150 people. The analysis test performed was multiple linear regression analysis and path analysis. The results of the study are 1) Quality of Human Resources has a positive and significant effect on employee performance, 2) Quality of service has a positive and significant effect on Employee Performance. 3) The quality of Human Resources has a positive and significant effect on community satisfaction. 4). Service quality has a positive and significant effect on community satisfaction. 5). Community satisfaction has a positive and significant effect on employee performance. 6). Community satisfaction can mediate the influence of the quality of Human Resources Performance on Employees, but the results are smaller than the results directly.7). Community satisfaction can mediate the effect of service quality on employee performance, but the results are smaller than the results directly.
Keywords
Quality of Human Resources
Quality of Service
Society and Employee Performance
INTRODUCTION
The development and progress of an organization cannot be separated from the role of human resources who will manage, control and organize all activities to achieve organizational goals. Human resources are formal systems in an organization to ensure the effective and efficient use of human talent to achieve organizational goals [1].
Quality of Human Resources is the ability of human resources to carry out the duties and responsibilities given to them with sufficient education, training and experience [2]. The quality of Human Resources in a service organization can be the main support and driving force of the organization in an effort to realize the vision, mission and goals of the organization [3]. According to Suharto [4] Quality of Human Resources is the ability of employees to carry out the inspection process which is seen from a person's skills, educational background, requirements that must be followed to be able to carry out the inspection process, training, professional issues and socialization of changing regulations.
Human resources are very important for every organization so they need to be managed, regulated and utilized so that they can function productively to achieve organizational goals. Likewise, the human resources owned by an organization need to be managed professionally to create a balance between employee needs and the demands and capabilities of the organization.
Human resources or employees are the main asset of every organization or company, because employees determine the success or failure of the organization in achieving organizational goals. To obtain the expected employees, one way is through developing the Quality of Human Resources which is based on calculating needs in accordance with job analysis and employee needs analysis, in order to obtain employees who are truly qualified in accordance with the needs of the organization [5].
Every human being needs service, in the extreme it can even be said that service cannot be separated from human life [6]. Therefore, the services provided to the community require a certain quality. Services provided by managers through their officers, although not aimed at making a profit, must still prioritize service quality that is in line with the demands, hopes and needs of the people served. In increasingly critical conditions in society, the public bureaucracy is required to be able to change its position and role (revitalization) in providing public services. From those who like to manage and rule, they change to those who like to serve. From those who like to use a power approach, they change to those who like to help towards a flexible, collaborative and dialogical direction. From sloganeering methods to realistic, pragmatic ways of working [7].
Poor public services have been one of the variables that has driven a crisis of public trust in the government. The crisis of public confidence is actualized in the form of protests and demonstrations which tend to be unhealthy, showing the public's frustration with their government. Therefore, improving the quality of service, human resources and employee performance is absolutely necessary so that the public's bad image of the government can be repaired, because by improving the quality of service and better human resources, it can influence public trust so that public satisfaction with the government can be rebuilt.
Assessing the quality of public services is not a very easy activity, especially the provision of public services of a service or administrative nature, but apart from these issues, the issue of the quality of public services is currently the center of attention in various democratic countries, especially Indonesia, because the provision of public services is currently the benchmark. To measure the quality of public services, sometimes researchers provide explanations regarding the meaning of service quality from various experts. According to Brady and Conin, it is explained that "service quality is a comparison between the reality of the service received and the expectations of the service you want to receive" [8]. Meanwhile, added by Parasuraman, Zeithaml, and Berry in [9] "service quality is a comparison of what consumers expect with the service they receive".
In measuring the extent of the quality of services that can be provided to the community, a guideline is needed that can measure the public's trust in the services provided by the government, for this reason it is necessary to have a survey/study of the impact of services that have been felt by the community. This is very in line with Minister of Administrative and Bureaucratic Reform Decree Number 16 of 2014 concerning Guidelines for surveying public satisfaction with the implementation of public services
Public satisfaction is the main factor that public service providers must pay attention to, because public satisfaction will determine the government's success in providing public services. The definition of community satisfaction is often confused with the definition of customer satisfaction or consumer satisfaction, this only differs in who the provider is and what the motive is for providing the service.
Service providers in public services are employees of government agencies who carry out public service duties in accordance with statutory regulations that have been mandated and recipients of public services are people, communities, government agencies and the business world, who benefit from an activity providing public services. Service satisfaction is based on Kep./25/M.PAN/2/2004, namely the result of public opinion and assessment of the service performance provided by public service administrators. Customer satisfaction is conceptualized as a feeling that arises after evaluating the experience of using a product.
According to Kotler and Keller [11] services are any action or activity that can be offered by a party to another party, which is basically intangible and does not result in any ownership. To find out whether the service provided can be accepted as good service, the quality of the service, in this case the quality of service at the agency, is very important to pay attention to. Service satisfaction that must be developed by Disdukcatpil must still refer to the rules determined by the government considering that Disdukcatpil is an institution that was established and developed and is responsible to the government, as stated in the Decree of the Minister for Empowerment of State Apparatus KepMenPAN No.25/KEP/M.PAN/ 2/2004 that service satisfaction is the result of public opinion and assessment of the service performance provided by public service administrators. For this reason, it is very important to know whether the services provided have resulted in good appreciation from the public or vice versa.
Performance or also called performance can mean achievement in organizing something, Moenir [12]. Performance is a procedure that includes: setting performance standards, assessing employees' actual performance in relation to these standards, providing feedback to employees with the aim of motivating the person to eliminate performance declines or continue to perform even higher. To find out the extent of the performance of a government organization, it is deemed necessary to carry out a performance evaluation activity. The importance of evaluating the performance of a government organization by Keban [13] states that: For every organization, assessing performance is a very important activity, this assessment can be used as a measure of the success of an organization within a certain period of time. Dwiyanto [14] suggested three main indicators for measuring government employee performance, including: Responsiveness is the organization's ability to recognize community needs, set service agendas and priorities and develop community service programs according to the needs of community aspirations.
The activities that need to be carried out are that every government agency is required to carry out individual performance assessments of each employee. The success of an organization is influenced by the individual performance of its employees. An organization will strive to improve the performance of its employees in the hope that company goals can be achieved. Performance is basically what employees do or don't do. Rivai [15] explains that performance is a level of overall success of employees within a certain period of time when completing their work in accordance with standard performance results, predetermined targets. The Pemalang Regency Population and Civil Registration Service is one of the public service units that serves population administration. . This public service unit is very interested in the quality of human resources and service quality, because it is directly related to the community. Therefore, one thing that needs to be considered is how to increase community satisfaction. The next effort is to motivate employees to work in accordance with Standard Operating Procedures (SOP) and also the existing work culture so that the quality of employee performance can be improved.
The research gap in this study is the relationship between variables. The influence of the quality of human resources on employee performance. The names of the researchers are Nurjaya et al (2021 and Yurina Khusnal Amaliyyah et al. The analysis method used is Multiple Linear Regression. The findings are that the quality of human resources has a positive effect and significant impact on Employee Performance. Relationship between variables. Influence of Quality of Human Resources on Employee Performance. Relationship between variables. Influence of Service Quality on Employee Performance. Research conducted by Muhammad Amhas. The analysis method used is Regression. The finding is that Quality of Human Resources is not influence/negative influence on Employee Performance. Relationship between variables. Influence of service quality on Employee Performance. Research conducted by Reiny et al. The analytical method used is Path Analysis.
Based on the background and research gap in previous research, I am interested in submitting research entitled: "Analysis of Human Resources Quality and Service Quality on Employee Performance with Community Satisfaction as an Intervening Variable for a Case Study at the Population and Civil Registry Service of Pemalang Regency"
The gap phenomenon that occurs in the Pemalang Regency Dukcapil Office is that the quality of Human Resources (HR) and the quality of service regarding employee performance are not yet optimal. This can be seen from the Evaluation Result Sheet (LHE) of the Implementation of Bureaucratic Reform at the Pemalang Regency Dukcapil Office from 2021 to 2022 from the Pemalang Regency Inspectorate which experienced a decrease in the Bureaucratic Reform Index (IRB) value as in the following table 1
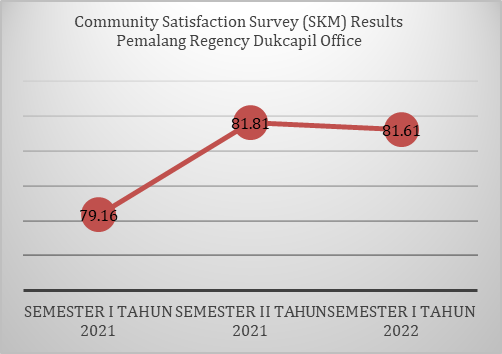
The Pemalang Regency Population and Civil Registration Service carries out Community Satisfaction Surveys (SKM) twice a year. The following is a graph of SKM Disdukcapil Pemalang Regency from 2021-2022:
From the data above in the first semester of 2021, it is known that the SKM result for the Pemalang Regency Population and Civil Registration Service was 79.16, then the SKM score increased very high in the second semester of 2021 with a total score of 81.81 and experienced a slight decrease which was not so significant in semester I of 2022, namely 81.61. The very high increase in the number of SKM in the first semester of 2021 is due to the innovation of LAKONE (Online Population Services) which was created by the Pemalang Regency Dukcapil Office so that people find it easy to process population registration documents, no need to go to the Pemalang Regency Dukcapil Office, just download or install the LAKONE application on Android cellphone on Playstore then register online to manage the required registration documents. Files will be sent either via Email (PDF) or via the Post Office. Meanwhile, at the beginning of 2022, this innovation had to be temporarily stopped due to the new Centralized SIAK policy. This then affected the SKM results in Semester I of 2022, which experienced a decrease in the number of scores, namely to 81.61.
Table 1: Bureaucratic Reform Index (IRB) value
No.
Year
Total Weight
Lever
IRB
Predicate
Rating
1
2020
36.30
22.57
62.18
B
3
2
2021
36.30
21.41
58.98
B
3
Figure 1: Community Satisfaction Surveys by the Pemalang Regency Population and Civil Registration Service (2021–2022)
Source: Pemalang Regency Population and Civil Registration Service
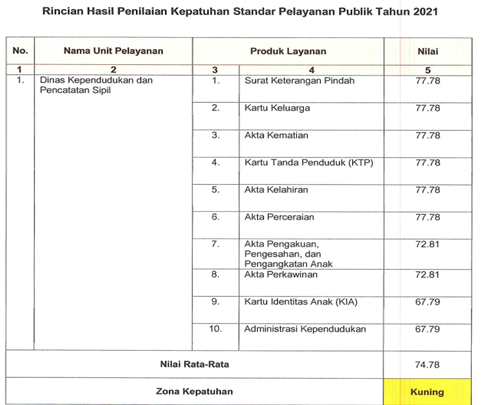
Figure 2: Assessment of Service Quality and Integrity in Pemalang Regency
Source: Letter from the Regent of Pemalang
Communities who were previously assisted no longer get convenience in population administration services, because they can no longer save on distance, time, costs and energy. Apart from that, many people complain about the completion time not being within the specified time. One of them is in making KTP-El which is stated in the policy of Standard Operating Procedures (SOP) and Public Service Standards (SPP) of the Pemalang Regency Dukcapil Office. The completion time for making KTP-El is 3 days, however, during its implementation many people complained that it took up to a week. (7 days) The El-KTP is not yet ready.
Another phenomenon is the lack of clarity in the distribution of population administration documents to applicants (the public). The complicated process of distributing e-KTP documents after they are printed at the Pemalang Regency Dukcapil Office, then handed over to the District TPDK after which they are handed back to the Village/Subdistrict Head's Office then handed over directly to the applicant. However, in practice there are still difficulties when tracking e-KTP documents and there is no guarantee that the documents will reach the applicant directly. Apart from that, this method is also prone to being misused/exploited by certain parties who do not have the authority to gain personal gain.
Another phenomenon is that there are still complaints from the public about unscrupulous officers committing extortion and receiving gratuities and there are many brokers who offer services for preparing registration documents by charging fees to the applicant, adding to classic problems that have not yet been resolved. source: Recapitulation of Complaints via the SP4AN LAPOR Channel, Pemalang Regency Dukcapil Disdukcapil which is directly connected to https://masbupati.lapor.go.id/ in 2021-2022.
This gap phenomenon means that public trust in the Population and Civil Registration Service of Pemalang Regency is relatively low and the public's image of the quality of services provided by officers is still not optimal. This is proven by the results of the implementation of the Integrity Zone of the Pemalang Regency Population and Civil Registry Department until now it has not yet received the title of a Corruption Free Area (WBK) and a Clean Serving Bureaucratic Area (WBBM). As well as the results of the Public Service Compliance assessment by the Ombudsman which is still in the yellow zone with an average score of 74.78.
The Pemalang Regency Dukcapil Disdukcapil has a service announcement and Values that must be used as guidelines by all employees in their work. However, in reality, not all employees know, understand and implement the service announcements, work culture, SOPs and values that exist in the Pemalang Regency Dukcatpil Disdukcatpil when working. The lack of optimal employee competence has affected the quality of services provided to the community. Employee competency development is still not optimal. Because technical guidance and training is rarely provided, especially for service officers who must have the skills and knowledge on how to serve applicants in a friendly and good manner, providing excellent service that makes the community happy (service excellent).
There is a slight deficiency in the public service facilities and infrastructure at the Pemalang Regency Dukcapil Disdukcapil, namely limited land means that the Pemalang Regency Dukcapil Disruption cannot provide free parking for applicants/the public. The problem that occurs is that when there are many applicants, there will be traffic jams along the Pemalang Regency Dukcapil District road because vehicles are parked on the shoulder of the road and their safety is not guaranteed.
Based on the background that has been described, the formulation of the problem in this research is:
How does the Quality of Human Resources influence Employee Performance
How does service quality influence employee performance
How does the Quality of Human Resources influence Community Satisfaction
How does service quality influence community satisfaction
How does community satisfaction influence employee performance
MATERIALS AND METHODS
The research approach that will be used in this research is a quantitative approach. According to Sugiyono [16] quantitative data is data in the form of numbers or qualitative data that is added up (scoring). The quantitative approach in this research is to look for the influence between the independent variable and the dependent variable which is mediated by an intervening variable.
The location of this research is the Population and Civil Registration Service of Pemalang Regency, while the research was conducted from 20 August to 5 September 2021.
The variables in this research include independent variables (free variables) which consist of the variable human resource quality (X1), service quality (X2), employee performance (Y) as the dependent variable (dependent variable) and the community satisfaction variable as the mediating intervening variable. Between the independent variable and the dependent variable.
In this research the author used two data sources, namely primary data sources, namely data taken using the questionnaire method. Secondary data sources are Employee Performance book documents and other relevant documents.
The technique used in collecting data for this research is the first to distribute questionnaires. Distribution of questionnaires is a data collection technique that is carried out by giving a set of questions or written statements to respondents for them to answer. The distribution of questionnaires in this research was used to obtain data regarding employee performance, community satisfaction and the quality of human resources and service quality. The second technique is documentation, which is looking for data regarding things or variables in the form of notes, transcripts, books, meeting minutes, agendas and so on. In this research, documentation was used to obtain data regarding the profile of the Pemalang Regency Dukcatpil Department, Organizational Structure, and employee data.
Table 2: Validity and Reliability test
No.
Variable
Cronbach's Alpha
Threshold
Note
1
Quality of HR
0.720 _
0.7 0 _
Reliable
2
Service quality
0.842 _
0.7 0 _
Reliable
3
Community satisfaction
0.814 _
0.7 0 _
Reliable
4
Employee performance
0.806 _
0.7 0 _
Reliable
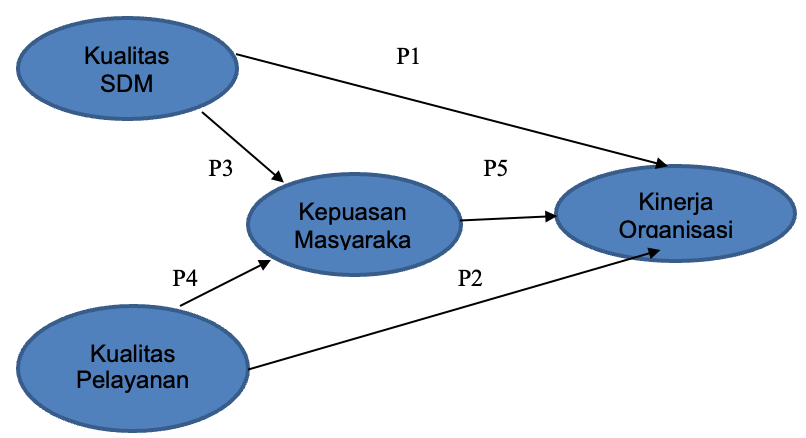
Figure 3: Path Analysis Model
This research instrument uses a closed questionnaire, namely a questionnaire that has provided alternative answers so that respondents just have to choose. Statements prepared as instruments consist of positive and negative statements. The measurement scale used is a Likert scale with 5 alternative answers, the scores on the respondents' alternative answers are as follows: strongly agree (SS) then the item score = 5, agree = 4, neutral = 3, disagree = 2 and strongly disagree = 1.
Documentation guidelines in this research are in addition to primary data obtained from direct respondents' answers, the researcher in this case also uses secondary data in the form of written data from the Pemalang Regency Dukcatpil Disdukcatpil as research respondents which includes profile data from the Pemalang Regency Dukcatpil Disdukcatpil and employee data.
Validity test
To test significance, this is done by comparing the calculated r value with r table with degree of freedom (df) = n-2, in this case n is the number of samples. In this study the number of samples was 150 so df = 150 – 2 = 148. With df 148 and alpha 0.05, the r table was 0.1603. Assessing the validity of each question item can be seen from the Corrected item -Total Correlation value of each question item. A question item is said to be valid if the calculated r value is the value from the Corrected item - Total Correlation >r table.
The Cronbach's Alpha value for all variables shows greater than 0.70, so it can be stated that these variables are reliable. The results of the reliability test concluded that the questionnaire from these variables could be used as a data collection tool.
Path Analysis
Sub structure equation 1 (Ghozali, 2011)
Z = b1X1+b2X2+e1
Information:
• Z : Community Satisfaction
• b1 and b2: Coefficient of each variable
• X1 : Resource Quality
• X2 : Service Quality
• e1 : Residual
Sub structure equation II (Ghozali, 2011)
Y = b3X1+b4X2+ b5Z+e1
Information:
• Y : Employee Performance
• b1, b2 and b5 : Coefficients of each variable
• X1 : Quality of Human Resources
• X2 : Service Quality
• Z : Community Satisfaction
• e1 : Residual
Information:
P = Direct Effect and Indirect Effect
To find out job satisfaction (Z) as an intervening variable, it needs to be analyzed using the following comparison model
.
Direct Influence
If p3p5<p1, then Z is not a mediating variable between variable X1 and Y
If p4p5<p2, then Z is not a mediating variable between variable X2 and Y
Indirect Influence
If p3p5 >p1, then Z is the mediating variable between variable X1 and Y
If p4p5 >p2, then Z is the mediating variable between variable X2 and Y
RESULTS
The results of the research analysis and discussion will begin with the identity recognition process for the 150 respondents. This is done to make it easier to understand in the following discussion. The next step is to explain the results of data processing according to the variables used in the research, so that it can provide predictive values for the variables used. From the results of the analysis, it will be continued with the next stage, namely a discussion of the influence of Human Resources quality and service quality on Employee Performance both directly and indirectly through community satisfaction. This research used 150 respondents who were people who received services from the Pemalang Regency Dukcapil Department. To find out a description of the respondent's identity, it will be divided into various characteristics such as gender, age and highest level of education.
Table 3: Respondents by Gender
No.
JK
Freq
%
1
L
98
65
2
P
52
35
2
P
52
35
Amount
150
Amount
Source: Primary data processed, 2022
Table 4: Respondents by Age
No.
Age
Freq
%
1
21 – 25 years
24
16
2
26 – 30 years
9
6
3
31 – 35 years
38
25
4
36 – 40 years
15
10
5
41 – 45 years
32
21
6
46 – 50 years
9
6
7
51 – 55 years
12
8
8
56 – 60 years old
10
7
9
61 and above
1
1
Amount
150
100
Source: Processed primary data, 2022
Table 5: Respondents based on Last Education
No
Last education
Freq
%
1
SMA/SMK
100
67
2
Diploma
8
5
3
Bachelor
39
26
4
Postgraduate
3
2
Amount
150
100
Source: Processed primary data, 2022
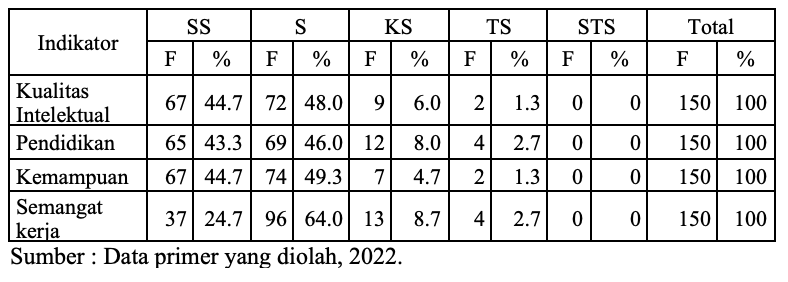
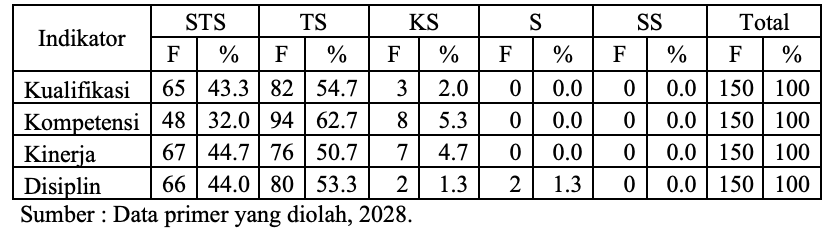
Figure 4: Respondents’ Responses about the Quality of Human Resources
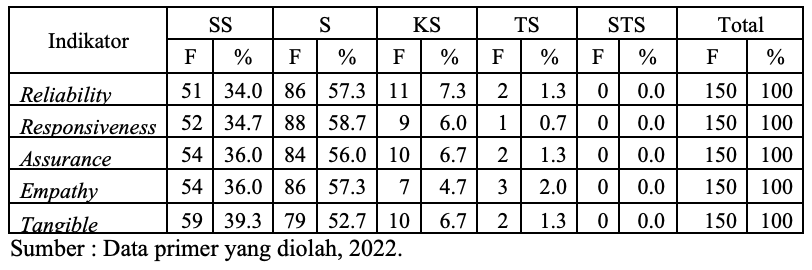
Figure 5: Respondents' Responses about Service Quality
Figure 7: Respondents' Responses about Employee Performance
Figure 8: First Model Linear Regression Results
Table 6: Regression Model Normality Test Results
Information
p- Value (Asymp. Sig.)
First linear regression model
0.067
Second linear regression model
0.200
Source: Processed primary data, 2022.
Table 7: First Model Multicollinearity Test Results
Model
Collinearity Statistics
Tolerance
VIF
1
(Constant)
Quality of HR
0,664
1,506
Service quality
0,664
1,506
a. Dependent Variable: Community Satisfaction
Source: Processed Primary Data, 2022
Based on the Table 3, it shows that of the 150 people who received services from the Pemalang Regency Dukcapil Department, the majority were men with 98 people (65%), while the remaining 52 people (35%) were women. This is because the processing of Population administration documents is usually carried out by the head of the household or an adult son.
Based on Table 4, it shows that of the 150 people who received services from the Pemalang Regency Dukcapil Department, the majority of respondents were aged 31 - 35 years with a total of 38 people (25%), while the least was aged between 61 years and over with a total of 1 person (1% ). This shows that the people who receive services from the Pemalang Regency Dukcapil Department are of productive age and have strong stamina. This is in accordance with conditions in the field that processing population administration documents requires stamina to follow management procedures and an understanding of these procedures.
Table 8: Second Model Multicollinearity Test Results
Model
Collinearity Statistics
Tolerance
VIF
1
(Constant)
Quality of HR
,555
1,803
Service quality
,496
2,018
Community Satisfaction
,442
2,262
a. Dependent Variable: Employee Performance
Source: Processed Primary Data, 2022
Figure 9: Heteroscedasticity Test
Figure 10: Heteroscedasticity Test Conclusion
Based on Table 5, it shows that of the 150 people who received services from the Pemalang Regency Dukcapil Department, the majority of respondents had a high school/vocational school education with a total of 100 people (67%), while the least had a postgraduate education with a total of 3 people (2%). This shows that people who receive services from the Pemalang Regency Dukcapil Department have sufficient educational capital to be able to understand population administration management procedures.
Descriptive Analysis of Variables
This analysis is used to determine respondents' responses regarding the variables Human Resource Quality (X1), Service Quality (X2), Employee Performance (Y) and Community Satisfaction (Z). To find out respondents' responses, a frequency distribution table will be used, so that researchers can find out the number and percentage of respondents' responses to the statements submitted.
Linear Regression Analysis
In this research, linear regression analysis was carried out to determine the effect of human resource quality (X1) and service quality (X2) on community satisfaction (Z). And to determine the influence of human resource quality (X1), service quality (X2) and community satisfaction (Z) on employee performance (Y). The testing tool was carried out using the SPSS (Statistical Product and Service Solutions) program version 23.0. The results of linear regression analysis can be seen as follows:
The Influence of Human Resource Quality and Service Quality on Community Satisfaction
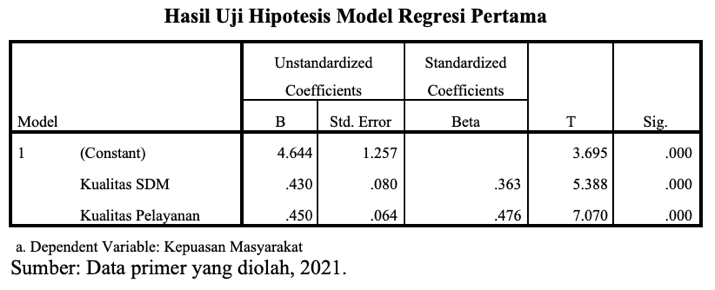
The results of the linear regression analysis carried out in the first model regarding the influence of human resource quality (X1) and service quality (X2) on community satisfaction (Z) are as follows:
Based on the analysis results in table 4.8 above, the first linear regression equation model can be writtenas follows:
Z = a+b1X1 + b1X2 + e
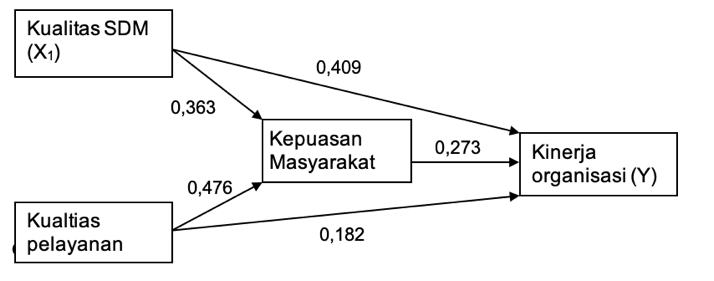
Z = 0 + 0.363X1 + 0.476 X2
The Influence of Human Resource Quality, Service Quality and Community Satisfaction on Employee Performance
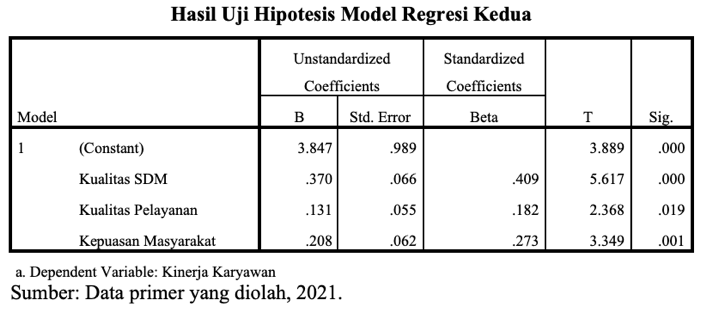
The results of the linear regression analysis carried out in the second model regarding the influence of Human Resources quality (X1), service quality (X2) and community satisfaction (Z) on Employee Performance (Y) are as follows:
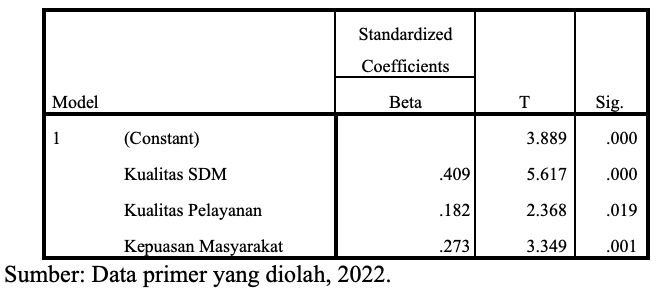
Based on the analysis results in table 4.9, the second linear regression equation model can be written as follows:
Y = b1X1 + b1X2 + b3Z + e
Y = 0.409 X1 + 0.182 X2 + 0.273 Z
Normality test
Based on the results of the normality test of the two linear regression models with the Kolmogorov-Smirnov test in the Table 6, the p value (Asymp. Sig) of the first linear regression model is 0.067, greater than 0.05, namely0.067>0.05. It can be concluded that the distribution of data in the regression model on the influence of human resource quality and service quality on community satisfaction follows a normal distribution, meaning that the first regression model meets the normality assumption.
The p-value (Asymp. Sig) of the second linear regression model is 0.200, greater than 0.05, namely 0.200>0.05. It can be concluded that the distribution of data in the regression model on the influence of Human Resources quality, service quality and community satisfaction on Employee Performance is normally distributed, meaning that the second regression model meets the normality assumption.
Multicollinearity Test
The multicollinearity test is intended to test whether the regression model finds a correlation between independent variables. The multicollinearity test will be carried out by looking at the tolerance value and the VIF (Variance Inflation Factor) value. If the tolerance value is greater than 0.10 and the VIF value is smaller than 10, then in the regression model there are no symptoms of multicollinearity, and vice versa. The results of the multicollinearity test in the research are as follows table 5.
Based on the results of the multicollinearity test in the Table 7, it shows that the HR quality and service quality variables each have a tolerance value >0.10 and a VIF value<10. This means that there is no correlation between the independent variables used. It can be concluded that there is no multicollinearity in the regression model of the influence of human resource quality and service quality on community satisfaction Based on the results of the multicollinearity test in Table 8, it shows that the variables Human Resources quality, service quality and community satisfaction each have a tolerance value>0.10 and a VIF value<10. This means that there is no correlation between the independent variables used. It can be concluded that there is no multicollinearity in the regression model of the influence of Human Resources quality, service quality, and community satisfaction on Employee Performance.
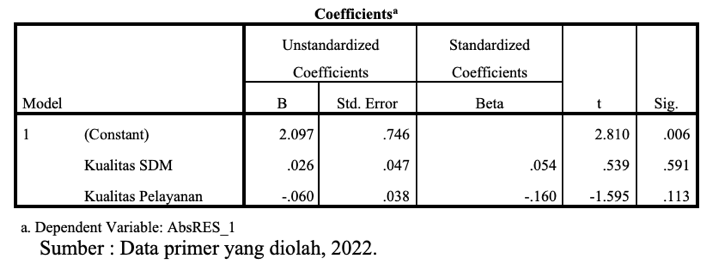
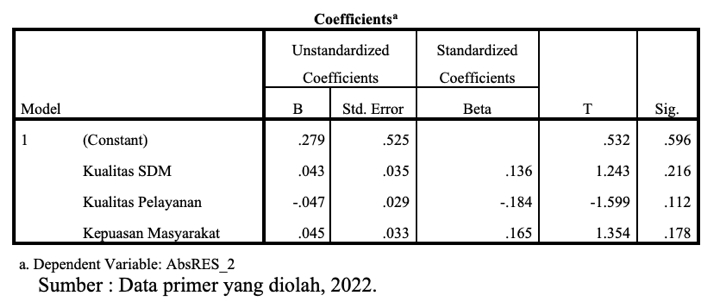
Heteroscedasticity Test
The heteroscedasticity test aims to test whether in the regression model there is an inequality of variance from the residuals of one observation to another. The heteroscedasticity test was carried out using a statistical test, namely the Glejser test. If the significance value is >0.05; then heteroscedasticity does not occur. On the other hand, if the significance value is <0.05; then heteroscedasticity occurs. The results of the heteroscedasticity test can be seen in the following figure no 5
Based on the results of the heteroscedasticity test in the Table 9, it shows that each variable of Human Resources quality and service quality has a significant value greater than 0.05. These results can be concluded that there is no heteroscedasticity in the regression model of the influence of Human Resources and service quality on community satisfaction.
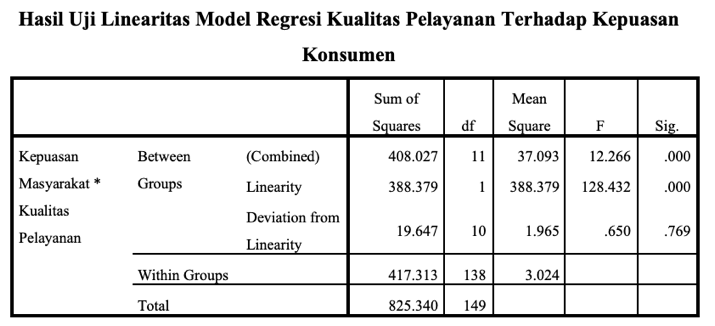
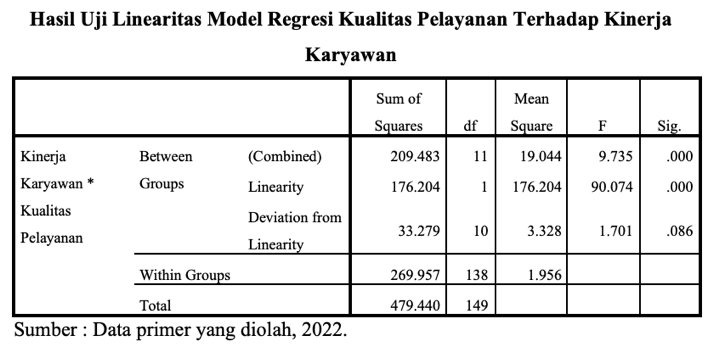
Linearity Test
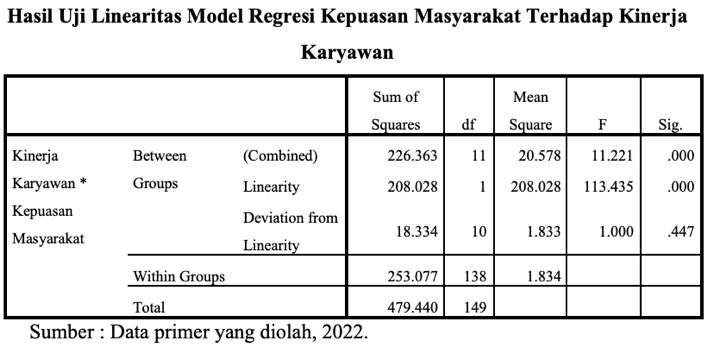
The linearity test aims to test whether the model specifications used are correct or not. Empirical models can be linear, quadratic and cubic [17]. In this research, the model specification used is linear. The linearity test was carried out using the Deviation from Linearity test with the criteria if the significance value was>0.05; then the regression model is linear, conversely if the significance value is<0.05; then the non-linear regression model. The results of the linearity test can be seen in the following figure no 7.
Based on the Figure 8, it can be seen that the significance probability value in the Deviation from Linearity line is 0.357>0.05, indicating that the relationship between HR quality and consumer satisfaction follows a linear model.
Based on the Figure 9, it can be seen that the significance probability value in the Deviation from Linearity row is 0.769 >0.05, indicating that the relationship between service quality and consumer satisfaction follows a linear model.
Based on the Figure 10, it can be seen that the significance probability value in the Deviation from
Figure 11: Linearity Test Deviation from Linearity
Figure 12: Linearity Test Conclusion
Figure 13: Linearity Test Conclusion
Table 9: Summary of Regression Model Determination Coefficient Results
Information
Adjusted R Squared Value
First linear regression model
0.552
Second linear regression model
0.563
Table 10: Summary of Regression Model F Statistical Test Results
Regression
Significant Value
First linear regression model
0,000
Second linear regression model
0,000
Figure 12: Hypothesis Testing Criteria
Linearity row is 0.058>0.05, indicating that the relationship between HR quality and employee performance follows a linear model [18-20].
Figure 13: Influence of service quality on community satisfaction
Figure 14: significant influence of community satisfaction on employee performance
Figure 15: Mediation Test
Figure 16: Analysis of Direct and Indirect Influence of Human Resource Quality and Service Quality
Based on the Table 10, it can be seen that the significance probability value in the Deviation from Linearity row is 0.086>0.05, indicating that the relationship between service quality and employee performance follows a linear model.
Based on the Table 9, it can be seen that the significance probability value in the Deviation from Linearity line is 0.447>0.05, indicating that the relationship between public satisfaction and employee performance follows a linear model.
Coefficient of Determination
Based on the results of the analysis in the table above, it shows that the value of the coefficient of determination for the first regression model as seen from the Adjusted R Square column is 0.552. It can be concluded that increasing the human resource quality and service quality variables can influence the increase in the community satisfaction variable by 55.2%, while the remaining 44.8% of the variation in changes in the community satisfaction variable can be explained by other variables.
The coefficient of determination value for the second regression model seen from the Adjusted R Square column is 0.563. It can be concluded that increasing the variables of HR quality, service quality and community satisfaction can influence the increase in the Employee Performance variable by 56.3%, while the remaining 43.7% of the change in the variation in the Employee Performance variable is explained by other variables that were not studied.
F Statistical Test
The F test in this research is used to test the suitability of the regression model as a tool for predicting the influence of the independent variable on the dependent variable.
Statistical Test
The F test in this research is used to test the suitability of the regression model as a tool for predicting the influence of the independent variable on the dependent variable. The criteria used are if a significance value <0.05 is obtained, then the fit regression model or changes in the independent variable can be used to predict changes in the dependent variable. The F test results can be seen in the following Table 10.
Based on the F test results in the table above, the significance probability value for the first linear regression model is 0.000 < 0.05, meaning that the resulting regression model is fit. This shows that the first regression model that measures the influence of human resource quality and service quality on community satisfaction is significant or suitable for use.
Meanwhile, in the second regression model, the significance probability value is 0.000 <0.05, meaning that the resulting regression model is fit. This shows that the second regression model which measures the influence of HR quality, service quality and community satisfaction on employee performance is significant or suitable for use.
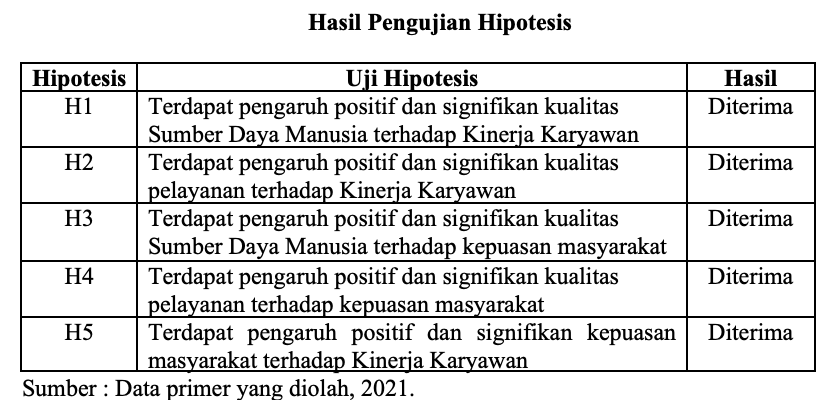
Hypothesis testing
To test the hypothesis in this research using the t test. It is said to be significant if the probability significance obtained is less than α = 5% (0.05), then the hypothesis is accepted, meaning there is a significant influence in a positive direction among the independent variables tested, conversely if the probability significance obtained is more than α = 5% (0.05), then the hypothesis is rejected, meaning there is no significant influence in a positive direction among the independent variables tested [31-35].
Based on the results of the first regression model hypothesis test in table 4.22, it shows that the regression coefficient value for the HR quality variable is 0.430 or has a positive sign, and the significance probability value is 0.000 or less than α = 5% (0.05). These results show that there is a positive and significant influence of the quality of Human Resources on community satisfaction [36-40].
The regression coefficient value for the service quality variable is 0.450 or has a positive sign, and the significance probability value is 0.000 or less than α = 5% % (0.05). These results show that there is a positive and significant influence of service quality on community satisfaction [41-42].
Based on the results of the first regression model hypothesis test in Table 8, it shows that the regression coefficient value for the Human Resources quality variable is 0.370 or has a positive sign, and the significance probability value is 0.000 or less than α = 5% (0.05). These results show that there is a positive and significant influence of the quality of Human Resources on Employee Performance.
The regression coefficient value for the service quality variable is 0.131 or has a positive sign, and the significance probability value is 0.019 or less than α = 5% (0.05). These results show that there is a positive and significant influence of service quality on employee performance [43-47].
The regression coefficient value for the community satisfaction variable is 0.208 or has a positive sign, and the significance probability value is 0.001 or less than α = 5% (0.05). These results show that there is a positive and significant influence of community satisfaction on employee performance.
The results of the hypothesis in this study can be summarized in the table below figure 14.
Mediation Test
To examine the direct and indirect influence of human resource quality and service quality on employee performance through community satisfaction, path analysis was used.
Results of Path Analysis of the Influence of Human Resource Quality and Service Quality on Employee Performance with the Community Satisfaction Variable as an Intervening Variable [48-52].
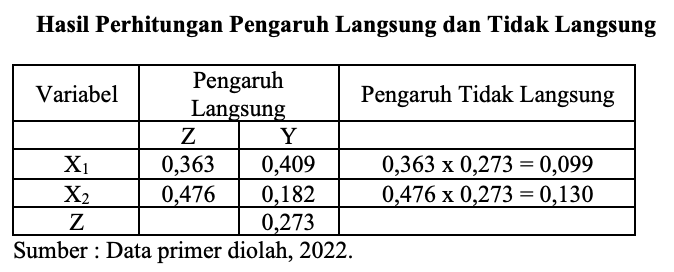
Based on this figure, the results of calculating the direct and indirect influence of Human Resource Quality and Service Quality on Employee Performance through community satisfaction are:
Based on the table above it can be explained as follows:
The indirect influence of the quality of Human Resources on Employee Performance through community satisfaction obtained a value of 0.099, and this value is smaller when compared to the direct influence of the Quality of Human Resources on Employee Performance, namely 0.409, which can be written as 0.099<0.409. These results mean that community satisfaction cannot strengthen or mediate the influence of Human Resource Quality on Employee Performance [53-55]
The indirect influence of service quality on employee performance through community satisfaction obtained a value of 0.130, and this value is smaller when compared to the direct influence of service quality on employee performance, namely 0.182, which can be written as 0.130<0.182. These results mean that community satisfaction cannot strengthen or mediate the influence of service quality on employee performance
DISCUSSION
Discussion regarding the influence of the quality of Human Resources, quality of service on Employee Performance with the variable community satisfaction as an intervening variable is as follows:
The influence of the quality of Human Resources on Performance: Based on the results of the analysis, it shows that the quality of Human Resources has a positive and significant effect on Employee Performance. This can be interpreted that the better the quality of Human Resources seen from intellectual quality, education, ability and good work spirit, the employee performance of the Pemalang Regency Population and Civil Registration Service will increase.These results indicate that the quality of Human Resources obtained by employees will be a determining factor in increasing the performance of employees at the Pemalang Regency Population and Civil Registration Service. This can be explained that human resources in an organization are a very important determinant of the effectiveness of activities within the organization. Organizational activities will run well if they have quality human resources. These quality human resources will be able to carry out the duties and responsibilities given to them, so that they will be able to support employee performance.The results of the descriptive analysis show that the majority of respondents responded in agreement with the statements submitted. This means that if the employees of the Pemalang Regency Population and Civil Registration Service have good qualities in terms of intellectual, educational, competency and work enthusiasm, then organizational performance will increase. These results support the research results of Astuti and Yasa which prove that the quality of human resources has a positive and significant effect on employee performance
The Influence of Service Quality on Employee Performance: Based on the results of the analysis, it shows that service quality has a positive and significant effect on employee performance. This can be interpreted as the better the quality of service seen from reliability, responsiveness, assurance, empathy and good tangibles, the employee performance of the Pemalang Regency Population and Civil Registration Service will increase.These results indicate that the quality of employee service will be an important factor in improving the performance of employees at the Pemalang Regency Population and Civil Registration Service. This can be explained that the Pemalang Regency Population and Civil Registration Service is a public service organization. Employee goals and performance can be achieved if they can serve the public/society. By providing good public services, of course you can improve employee performance.The results of the descriptive analysis show that the majority of respondents responded in agreement with the statements submitted. This means that if employees of the Pemalang Regency Population and Civil Registration Service can provide good, friendly, professional public services and are able to position themselves in the community and understand the needs and perceptions of the community, of course they can improve employee performance. These results support the research results of Ali, et al. conducted an empirical study which revealed that service quality has a positive and significant effect on employee performance [56-60]
The Influence of Human Resource Quality on Community Satisfaction: Based on the results of the analysis, it shows that the quality of Human Resources has a positive and significant effect on community satisfaction. This can be interpreted as the better the quality of Human Resources seen from intellectual quality, education, ability and good work spirit, the community satisfaction will increase.These results indicate that the quality of Human Resources will be an important factor in increasing community satisfaction. The quality of human resources in an organization has a very important position because it is determined by the quality of the people who work in it. If a public organization such as the Pemalang Regency Population and Civil Registration Service has quality employees, of course the community will feel satisfied, with the hope that these employees can work well and responsibly in serving the community.The results of the descriptive analysis show that the majority of respondents responded in agreement with the statements submitted. This means that if the employees of the Pemalang Regency Population and Civil Registration Service have the competence and abilities in accordance with community expectations, this will certainly increase community satisfaction. The results of this research support previous research conducted by Abdiansyah, et al which proved that the quality of Human Resources has a significant positive effect on community satisfaction
The Influence of Service Quality on Community Satisfaction: Based on the results of the analysis, it shows that service quality has a positive and significant effect on community satisfaction. This can be interpreted that the better the quality of service seen from reliability, responsiveness, assurance, empathy, and good tangibles, the satisfaction of the people who receive services from the Pemalang Regency Dukcatpil Disdukcatpil will increase.These results indicate that service quality will be an important factor in increasing the satisfaction of people who receive services from the Pemalang Regency Dukcatpil Department. As a public organization, the Pemalang Regency Disdukcatpil aims to provide good services to the community. If the services provided by Pemalang Regency Dukcatpil Disdukcatpil employees are good, friendly, according to established standards, fair and in accordance with what the community needs, this will of course increase community satisfaction.The results of the descriptive analysis show that the majority of respondents responded in agreement with the statements submitted. This means that if people receive good service in accordance with their expectations, satisfaction will increase. These results support the research results of Abdiansyah, et al who conducted an empirical study which revealed that service quality has a positive and significant influence on community satisfaction[61-67]
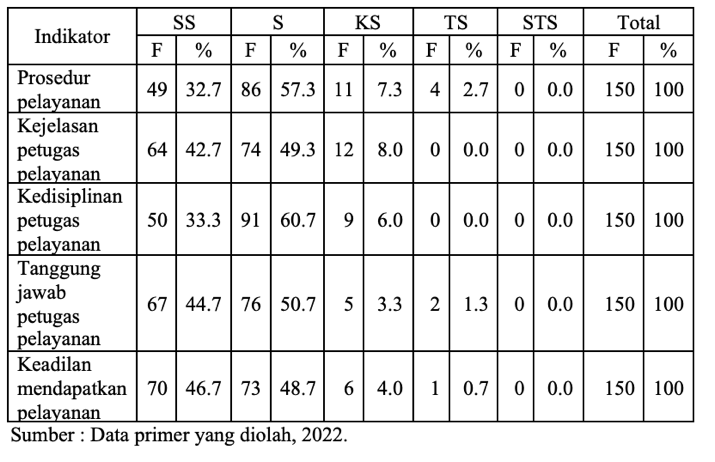
The Influence of Community Satisfaction on Employee PerformanceBased on the results of the analysis, it shows that community satisfaction has a positive and significant effect on employee performance. This can be interpreted that with better public satisfaction as seen from the ease of service procedures, clarity of service officers, discipline of service officers, responsibility of service officers, fairness in getting good service, the performance of Pemalang Regency Dukcatpil Disdukcatpil employees will increase.These results indicate that community satisfaction will be an important factor in improving the performance of Pemalang Regency Dukcatpil Disdukcatpil employees. As a public service organization for the Pemalang Regency Disdukcatpil, its performance is considered good if the people who receive its services feel satisfied and happy. This means that if community satisfaction increases, it is certainly an achievement for the organization.The results of the descriptive analysis show that the majority of respondents responded in agreement with the statements submitted. This means that if the public finds it easy to get information on Disdukcapil service procedures, gets fast service and feels that the service results are in accordance with applicable regulations and in line with community expectations, they will be able to improve the performance of Pemalang Regency Disdukcatpil employees [68-70]
Mediating Effect of Community Satisfaction on the Influence of Human Resource Quality on Employee Performance:Based on the results of the analysis, it shows that community satisfaction cannot mediate the influence of Human Resources quality on Employee Performance, meaning that community satisfaction does not mediate the influence of Human Resources quality on Employee Performance. This means that the higher the quality of Human Resources through community satisfaction cannot improve employee performance
Mediating Effect of Community Satisfaction on the Influence of Service Quality on Employee Performance: Based on the results of the analysis, it shows that community satisfaction cannot mediate the influence of service quality on employee performance, meaning that community satisfaction does not mediate the influence of service quality on employee performance
CONCLUSIONS AND RECOMMENDATIONS
The conclusions that can be drawn from the data and discussions carried out in the previous chapter are:
The quality of human resources has a positive and significant effect on employee performance at the Pemalang Regency Dukcatpil Office. Thus, the quality of Human Resources is one of the causes of increasing employee performance. The better the quality of Human Resources, the better the Employee Performance will be [71-73]
Service quality has a positive and significant effect on employee performance at the Pemalang Regency Dukcatpil Office. Thus, service quality is one of the causes of increased employee performance. The better the quality of service, the better the employee performance will be
The quality of human resources has a positive and significant effect on the satisfaction of people who receive services at the Pemalang Regency Dukcatpil Office. Thus, the quality of Human Resources is one of the causes of increasing community satisfaction. The better the quality of Human Resources, the better the community satisfaction
Service quality has a positive and significant effect on the satisfaction of people who receive services at the Pemalang Regency Dukcatpil Office. Thus, service quality is one of the causes of increasing public satisfaction. The better the quality of service, the better the community satisfaction
Community satisfaction has a positive and significant effect on employee performance at the Pemalang Regency Dukcatpil Office. Thus, community satisfaction is one of the causes of increased employee performance. The better the community satisfaction, the better the employee performance will be
Community satisfaction can mediate the influence of the quality of Human Resources on Employee Performance at the Pemalang Regency Disdukcatpil Office
Community satisfaction cannot mediate the influence of service quality on employee performance at the Pemalang Regency Disdukcatpil Office
Suggestion
Based on the discussion, conclusions and findings described above, the researcher proposes several suggestions as follows:
To sustain performance improvements in the long term, leadership and senior management need to focus on organizational development. Analyze employee abilities and skills in important functional areas. Apart from that, you can plan organizational transformation that involves employees
Leadership and management should pay attention to the needs and interests of the community, because employee performance effectiveness only works well when evaluating the needs and interests of the community. To find out the needs and interests of the community, this can be done by asking the community to fill out a survey or answer questions about the services provided. Find out what people want from the organizations or services they consider most valuable for their needs and goals
Parties can utilize technology to improve services. Use social media pages or other online tools to get feedback from the community. Allow the public to leave comments or point out weaknesses in Disdukcapil services by asking questions on social media or the Pemalang Regency Disdukcapil website
Implications
Based on the conclusions above, it is known that the independent variable studied has a positive influence on the dependent variable. This shows that improving employee performance can be done by improving the quality of human resources, service quality and community satisfaction. The long-term impacts of the results of this research are as follows:
Improving the Quality of Human Resources:Theresults of this research indicate that the quality of Human Resources has a positive and significant effect on increasing employee performance at the Pemalang Regency Disdukcatpil Office. This requires management and organizational leaders to pay attention to aspects of the quality of Human Resources, improving the intellectual quality, education, abilities and work enthusiasm of employees so that they can work to support the achievement of organizational goals, namely providing maximum public services
Improving Service Quality: The results of this research indicate that service quality has a positive and significant effect on employee performance at the Pemalang Regency Disdukcatpil Office. This requires related parties to pay attention to aspects of reliability, responsiveness, assurance, empathy and tangible which can improve service quality
Increase community satisfaction: The results of this research show that community satisfaction has a positive and significant effect on employee performance at the Pemalang Regency Disdukcatpil Office. This requires related parties to pay attention to aspects of community satisfaction, ease of obtaining information on service procedures, clarity of service officers, discipline of service officers, responsibility of service officers and fairness in service
Future Research Agenda
Some future research agendas that can be provided from this research include:
Future research needs to add or include other variable constructs that can influence employee performance. Future research needs to raise discourse in the field regarding public trust, so that it can increase public satisfaction with employee performance
Future research should direct research to broader research objects, to obtain more general results on factors that influence employee performance and can increase public satisfaction
Exploratory Factor Analysis (EFA) can be carried out so that investigations into the indicators that form an updated construct can refine existing theories
REFERENCE
Mathis, R.L. and Jackson, J.H. "Manajemen sumber daya manusia." Salemba Empat, 2012.
Widodo, J. "Good governance." Insan Cendek, 2001.
Arsyad, A. "Media pembelajaran." Raja Grafindo Persada, 2007.
Suharto, A.A. "Pengaruh kualitas sumber daya manusia, komitmen dan motivasi terhadap kinerja pegawai pada inspektorat kabupaten Kediri." Jurnal Ilmu Manajemen, Revitalisasi vol. 1, no. 3, 2012.
Hersona et al. "Analisis pengaruh pengembangan SDM terhadap kinerja pegawai pada badan kepegawaian daerah kabupaten Karawang." Jurnal Manajemen vol. 9, no. 3, 2012, pp. 717–729.
Sinambela, L.P. et al. "Reformasi pelayanan publik." Bumi Aksara, 2010.
Thoha, C. "Kapita selekta pendidikan Islam." Pustaka Belajar, 1996.
Afrial, R.J. "Kualitas pelayanan publik kecamatan setelah perubahan." 2009.
Samosir, Z.Z. "Pengaruh kualitas pelayanan terhadap kepuasan mahasiswa menggunakan perpustakaan USU." Jurnal Studi Perpustakaan dan Informasi vol. 1, no. 1, 2005.
Tjiptono, F. and Chandra, G. "Manajemen pelayanan jasa." ANDI, 2006.
Kotler, P. and Keller. "Manajemen pemasaran." Erlangga, 2008.
Moenir. "Manajemen pelayanan publik." Bina Aksara, 2000.
Keban, J.T. "Indikator kinerja pemerintah daerah." UGM, 1995.
Dwiyanto, A. "Penilaian kinerja karyawan pelayanan publik." Fisipol Universitas Gajahma, 1995.
Rivai, V. et al. "Manajemen sumber daya manusia untuk perusahaan: Dari teori ke praktik." Raja Grafindo Persada, 2015.
Sugiyono. "Metode penelitian pendidikan pendekatan kuantitatif." Rineka Cipta, 2010.
Ghozali, I. "Aplikasi analisis multivariete dengan program IBM SPSS 23." Badan Penerbit Universitas Diponegoro, 2016.
Achmad, K. "Cara menggunakan dan memaknai analisis asumsi." 2001.
Arikunto, S. "Prosedur penelitian suatu pendekatan praktis." Rineka Cipta, 2014.
Atmosudirjo. "Human resource management (manajemen sumber daya manusia)." Prehalindo Badan Penerbit UNDIP, 1997.
Nasution, A. "Hukum perlindungan konsumen suatu pengantar." Diadit Media, 2001.
Bastian, I. "Lingkup akuntansi sektor publik." 2013, pp. 1–52.
Chaizi, N. "Reformasi administrasi publik: Teori dan aplikasi." Gramedia Widiasarana Indonesia, 2004.
Christian, P.R. et al. "Analisis kualitas sumber daya manusia, kualitas pelayanan, kinerja karyawan, kepercayaan masyarakat, dan kepuasan masyarakat." Jurnal Teknologi dan Manajemen Industri vol. 1, no. 1, 2015, pp. 1–7.
Darwin, S. and Kunto, S. "Analisis pengaruh kualitas layanan terhadap loyalitas pelanggan dengan kepuasan dan kepercayaan pelanggan sebagai variabel intervening." Jurnal Manajemen Pemasaran Petra vol. 2, no. 1, 2014.
Darwin, Steven and Kunto, Sondang. "Analisis pengaruh kualitas layanan terhadap loyalitas pelanggan dengan kepuasan dan kepercayaan pelanggan sebagai variabel intervening pada asuransi jiwa Manulife Indonesia-Surabaya." Jurnal Manajemen Pemasaran Petra, vol. 2, no. 1, 2014. Translated by Halida, S.E. and Dewi Sartika, S.S. Erlangga, Jakarta.
Djaslim, Saladin. Manajemen pemasaran: Analisis, perencanaan, pelaksanaan, dan pengendalian. Linda Karya, 2003.
Yulianto, Gatot. "Pengaruh keefektifan komunikasi, kualitas teknikal, kualitas fungsional dan kepercayaan pada komitmen keterhubungan bandara Ahmad Yani Semarang." Telaah Manajemen, vol. 1, no. 3, 2004.
Goleman, Daniel. Kecerdasan emosional untuk mencapai puncak prestasi. Translated by Alex Tri Kantjono Widodo, PT Gramedia Pustaka, 2002.
Hutapea, Parulian and Thoha, Nurianna. Kompetensi plus: Teori, desain, kasus dan penerapan untuk HR dan organisasi yang dinamis. Gramedia Pustaka Utama, 2008.
Supranto, J. "Pengukuran tingkat kepuasan pelanggan." Rineka Cipta, Jakarta, 1997.
Kadarisman, M. Manajemen pengembangan sumber daya manusia. Jakarta.
"Kedudukan dan fungsi camat sebagai perangkat daerah." Jurnal Ilmu Administrasi dan Organisasi, vol. 16, no. 2, pp. 87–95.
Keputusan Menteri Pendayagunaan Aparatur Negara No. 25 Tahun 2004.
Keputusan Menteri Pendayagunaan Aparatur Negara Nomor KEP/25/M.PAN/2/2004 tentang pedoman umum penyusunan indeks kepuasan masyarakat unit pelayanan instansi pemerintah.
Kotler, Philip and Kevin Lane Keller. Manajemen pemasaran. Jilid I, Edisi, Jakarta, 2007.
Kotler, Philip. Manajemen pemasaran. Jilid 1 dan 2, PT Indeks Kelompok Gramedia, Jakarta, 2005.
Kotler, Philip. Manajemen pemasaran. Jilid 1 dan 2, PT Indeks Kelompok Gramedia, Jakarta, 2005.
Kristiani, B.R. "Kualitas minuman serbuk effervescent serai (Cymbopogon nardus (L.) Rendle)." Skripsi, Universitas Atma Jaya Yogyakarta, 2013.
Lehtinen, U. and J.R. Lehtinen. "Service quality: A study of quality dimensions." Service Management Institute, 1982.
Lestari, Ni Made Sri. "Pengaruh partisipasi pemakai sistem informasi, kemampuan personal, pemanfaatan teknologi informasi, dan peran pengawas internal terhadap efektivitas sistem informasi akuntansi pada lembaga perkreditan desa (LPD) Se-Kecamatan Sukasada." e-Journal S1 Ak Universitas Pendidikan Ganesha, vol. 7, no. 1, pp. 1–12.
Lovelock, Christopher, Jochen Wirtz, and Jacky Mussry. Pemasaran jasa perspektif Indonesia. Jilid 1, Penerbit Erlangga, Jakarta, 2010.
Mangkunegara, A.A. Manajemen sumber daya perusahaan. PT Remaja Rosdakarya, Bandung, 2011.
Mathis, Robert L. and John H. Jackson. Manajemen sumber daya manusia. Edisi pertama, Salemba Empat, Jakarta, 2012.
Matutina. Manajemen sumber daya manusia. Cetakan kedua, Gramedia Widia Sarana Indonesia, Jakarta, 2001.
Moeheriono. "Pengukuran kinerja berbasis kompetensi." Raja Grafindo Persada, Jakarta, 2012.
Moenir, H.A.S. Manajemen pelayanan umum di Indonesia. Bumi Aksara, Jakarta, 2006.
Notoatmodjo, S. Kesehatan masyarakat ilmu dan seni. Rineka Cipta, Jakarta, 2007.
Notoatmodjo, Soekidjo. Pengembangan sumber daya manusia. Cetakan keempat, edisi revisi, Rineka Cipta, Jakarta, 2009.
Pamuji, S. Ekologi administrasi negara. Bina Aksara, Jakarta, 2004.
Parasuraman, Valarie A. Zeithaml, and Leonard L. Berry. "SERVQUAL: A multiple-item scale for measuring consumer perceptions of service quality." Journal of Retailing, vol. 64, no. 1, pp. 123–137, 1988.
Pasolong, Harbani. Teori administrasi publik. Alfabeta, Bandung, 2010.
Peraturan Menteri Pendayagunaan Aparatur Negara dan Reformasi Birokrasi Republik Indonesia Nomor 38 Tahun 2018.
Peraturan Menteri Pendayagunaan Aparatur Negara dan Reformasi Birokrasi No. 38 Tahun 2018 tentang pengukuran indeks profesionalitas aparatur sipil negara.
Wibowo, S.E., Perilaku dalam organisasi. Cetakan kedua, PT Raja Grafindo Persada, Jakarta, 2013.
Rahardjo, M. Pembangunan kota optimum, efisien dan mandiri. Yogyakarta, 2010.
Raja Grafindo Persada. Manajemen perusahaan. Jakarta, 2001.
Ratminto. Manajemen pelayanan. Pustaka Pelajar, Yogyakarta, 2006.
Rivai, Veithzal. Manajemen sumber daya manusia untuk perusahaan: Dari teori ke praktik. PT Raja Grafindo Persada, Jakarta, 2005.
Robbins, Stephen P. and Mary Coulter. Manajemen. Jilid 1 dan 2, Edisi kedelapan, Jakarta, 2009.
Robbins, P. Stephen. Prinsip-prinsip perilaku organisasi. Edisi kelima, 2002.
Sedarmayanti. Sumber daya manusia dan produktivitas kerja. CV Mandar Maju, Bandung, 2009.
Sinambela, Lijan Poltak. Reformasi pelayanan publik. Bumi Aksara, Jakarta, 2006.
Sinambela, Lijan Poltak. Kinerja pegawai. Graha Ilmu, Yogyakarta, 2012.
Soekanto, Soerjono. Sosiologi suatu pengantar. PT Raja Grafindo, Jakarta, 2003.
Sudarmanto. Kinerja dan pengembangan kompetensi SDM. Yogyakarta, 2009.
Sugandha. Metode penelitian kuantitatif dan kualitatif. Alfabeta, Jakarta, 2005.
Tangkilisan, Hessel N.S. Manajemen publik. PT Grasindo, Jakarta, 2005.
Tjiptono, Fandy and G. Chandra. Service, quality, and satisfaction. Penerbit Andi, Yogyakarta, 2005.
Tjiptono, Fandy. Manajemen jasa. Edisi ketiga, Andi Offset, Yogyakarta, 2000.
Tjiptono. Manajemen jasa. BPFE, Yogyakarta, 2006.
Winarsunu, Tulus. Statistika dalam penelitian psikologi dan pendidikan. Universitas Muhammadiyah Malang, Malang, 2006, p. 180.
Umam. Perilaku organisasi. Pustaka Setia, Bandung, 2010.
License
Creative Commons Attribution-NonCommercial-NoDerivatives 4.0 International License
All papers should be submitted electronically. All submitted manuscripts must be original work that is not under submission at another journal or under consideration for publication in another form, such as a monograph or chapter of a book. Authors of submitted papers are obligated not to submit their paper for publication elsewhere until an editorial decision is rendered on their submission. Further, authors of accepted papers are prohibited from publishing the results in other publications that appear before the paper is published in the Journal unless they receive approval for doing so from the Editor-In-Chief.
Himalayan Journal of Economics and Business Management open access articles are licensed under a Creative Commons Attribution-Share A like 4.0 International License. This license lets the audience to give appropriate credit, provide a link to the license, and indicate if changes were made and if they remix, transform, or build upon the material, they must distribute contributions under the same license as the original.
Advertisement
Recommended Articles
Research Article
Modelling Structure Job Quality, Job Design and Job Satisfaction
Moch Nurhadi,
...
Avi Sunani
Published: 30/08/2022
Download PDF
Cite
x
APA
Nurhadi, M., Bisyri Effendi, M., Saiful Ulum, A. & Sunani, A. (2022). Modelling Structure Job Quality, Job Design and Job Satisfaction. Himalayan Journal of Economics and Business Management, 3(2), 1-4.
MLA
Nurhadi, Moch, et al. "Modelling Structure Job Quality, Job Design and Job Satisfaction." Himalayan Journal of Economics and Business Management 3.2 (2022): 1-4.
Chicago
Nurhadi, Moch, Moch Bisyri Effendi, Achmad Saiful Ulum and Avi Sunani. "Modelling Structure Job Quality, Job Design and Job Satisfaction." Himalayan Journal of Economics and Business Management 3, no. 2 (2022): 1-4.
Harvard
Nurhadi, M., Bisyri Effendi, M., Saiful Ulum, A. and Sunani, A. (2022) 'Modelling Structure Job Quality, Job Design and Job Satisfaction' Himalayan Journal of Economics and Business Management 3(2), pp. 1-4.
Vancouver
Nurhadi M, Bisyri Effendi M, Saiful Ulum A, Sunani A. Modelling Structure Job Quality, Job Design and Job Satisfaction. Himalayan Journal of Economics and Business Management. 2022 Jul;3(2):1-4.
Download PDF
Research Article
Accountability and Transparency of Village Fund Management in Lumajang District
Nurina Ayuningtiyas,
...
Muhammad Miqdad
Published: 28/12/2023
Download PDF
Cite
x
APA
Ayuningtiyas, N., Santosa Putra, H. & Miqdad, M. (2023). Accountability and Transparency of Village Fund Management in Lumajang District. Himalayan Journal of Economics and Business Management, 4(2), 1-4.
MLA
Ayuningtiyas, Nurina, Hendrawan Santosa Putra and Muhammad Miqdad. "Accountability and Transparency of Village Fund Management in Lumajang District." Himalayan Journal of Economics and Business Management 4.2 (2023): 1-4.
Chicago
Ayuningtiyas, Nurina, Hendrawan Santosa Putra and Muhammad Miqdad. "Accountability and Transparency of Village Fund Management in Lumajang District." Himalayan Journal of Economics and Business Management 4, no. 2 (2023): 1-4.
Harvard
Ayuningtiyas, N., Santosa Putra, H. and Miqdad, M. (2023) 'Accountability and Transparency of Village Fund Management in Lumajang District' Himalayan Journal of Economics and Business Management 4(2), pp. 1-4.
Vancouver
Ayuningtiyas N, Santosa Putra H, Miqdad M. Accountability and Transparency of Village Fund Management in Lumajang District. Himalayan Journal of Economics and Business Management. 2023 Jul;4(2):1-4.
Download PDF
Research Article
Proposed Digital Marketing Strategy to Enhance Engineering Consultancy Company Revenue
Alfarisy, K. A.,
Wandebori, H.
Published: 30/04/2024
Download PDF
Cite
x
APA
K. A., A. & H., W. (2024). Proposed Digital Marketing Strategy to Enhance Engineering Consultancy Company Revenue. Himalayan Journal of Economics and Business Management, 5(1), 1-18.
MLA
K. A., Alfarisy, and Wandebori, H.. "Proposed Digital Marketing Strategy to Enhance Engineering Consultancy Company Revenue." Himalayan Journal of Economics and Business Management 5.1 (2024): 1-18.
Chicago
K. A., Alfarisy, and Wandebori, H.. "Proposed Digital Marketing Strategy to Enhance Engineering Consultancy Company Revenue." Himalayan Journal of Economics and Business Management 5, no. 1 (2024): 1-18.
Harvard
K. A., A. and H., W. (2024) 'Proposed Digital Marketing Strategy to Enhance Engineering Consultancy Company Revenue' Himalayan Journal of Economics and Business Management 5(1), pp. 1-18.
Vancouver
K. A. A, H. W. Proposed Digital Marketing Strategy to Enhance Engineering Consultancy Company Revenue. Himalayan Journal of Economics and Business Management. 2024 Jan;5(1):1-18.
Download PDF
Research Article
The Constitutional and Legislative Basis for Considering the Taxable Capacity of Taxpayers in Iraqi Tax Legislation
Hussein Kamel Wadaa
Published: 05/05/2025
Download PDF
Cite
x
APA
Wadaa, H. K. (2025). The Constitutional and Legislative Basis for Considering the Taxable Capacity of Taxpayers in Iraqi Tax Legislation. Himalayan Journal of Economics and Business Management, 6(1), 1-10.
MLA
Wadaa, Hussein Kamel. "The Constitutional and Legislative Basis for Considering the Taxable Capacity of Taxpayers in Iraqi Tax Legislation." Himalayan Journal of Economics and Business Management 6.1 (2025): 1-10.
Chicago
Wadaa, Hussein Kamel. "The Constitutional and Legislative Basis for Considering the Taxable Capacity of Taxpayers in Iraqi Tax Legislation." Himalayan Journal of Economics and Business Management 6, no. 1 (2025): 1-10.
Harvard
Wadaa, H. K. (2025) 'The Constitutional and Legislative Basis for Considering the Taxable Capacity of Taxpayers in Iraqi Tax Legislation' Himalayan Journal of Economics and Business Management 6(1), pp. 1-10.
Vancouver
Wadaa HK. The Constitutional and Legislative Basis for Considering the Taxable Capacity of Taxpayers in Iraqi Tax Legislation. Himalayan Journal of Economics and Business Management. 2025 Jan;6(1):1-10.
Sasti Fintani, P. (2023). Analysis of Human Resources Quality and Service Quality on Employee Performance with Community Satisfaction as an Intervening Variable. Himalayan Journal of Economics and Business Management, 4(2), 1-14.
MLA
Sasti Fintani, Pubita. "Analysis of Human Resources Quality and Service Quality on Employee Performance with Community Satisfaction as an Intervening Variable." Himalayan Journal of Economics and Business Management 4.2 (2023): 1-14.
Chicago
Sasti Fintani, Pubita. "Analysis of Human Resources Quality and Service Quality on Employee Performance with Community Satisfaction as an Intervening Variable." Himalayan Journal of Economics and Business Management 4, no. 2 (2023): 1-14.
Harvard
Sasti Fintani, P. (2023) 'Analysis of Human Resources Quality and Service Quality on Employee Performance with Community Satisfaction as an Intervening Variable' Himalayan Journal of Economics and Business Management 4(2), pp. 1-14.
Vancouver
Sasti Fintani P. Analysis of Human Resources Quality and Service Quality on Employee Performance with Community Satisfaction as an Intervening Variable. Himalayan Journal of Economics and Business Management. 2023 Jul;4(2):1-14.