This study focuses on addressing challenges in the management of refurbished parts at PT XYZ, an oil and gas Services Company. The company grapples with substantial challenges, including high equipment downtime and extended lead times for new parts, leading to considerable revenue losses and impacting project timelines. In response to these challenges, the research employs the DMAIC methodology within the Lean Six Sigma framework to investigate and propose strategies for enhancing efficiency in PT XYZ's Well Construction division. The study specifically aims to significantly reduce the Down for Parts (DFP) rate, a key metric measuring equipment downtime due to part unavailability. Remarkably, the primary goal of achieving a DFP rate of 2.6% has been surpassed, with the DFP rate decreasing impressively from 3.3% to 2.45%. This achievement is accompanied by a substantial reduction in average equipment downtime from 11 to 6 days. Additionally, there is a notable improvement in the sigma level, reflected in both DPMO, which increased from 2.6 to 3.1, and maintenance days, rising from 1.5 to 2.9. The practical implications of this research are substantial, offering actionable insights with broad applicability across industries. The results are intended to guide organizations in optimizing maintenance procedures, minimizing equipment downtime, and enhancing overall materials management efficiency. The research aims to bridge the gap between theoretical understanding and practical solutions in the fields of equipment maintenance and materials management.
Keywords
Inventory
Lean Six Sigma
Materials Management
Refurbished Parts Management
Quality Control
BACKGROUND TO THE STUDY
Indonesia, the world's fourth-most populous country, has witnessed an average annual GDP growth rate of 5% over the past three decades, which is manifested in its energy supply [7]. This growth has led to Indonesia becoming one of the largest economy in Southeast Asia based on purchasing power. The country's energy consumption has followed a similar trend, with an increasing demand for energy as the economy develops [1]. Currently, Indonesia heavily relies on fossil fuels such as coal, oil, and natural gas for its energy supply. Between 2000 and 2019, the country witnessed a doubling of its overall primary energy supply. Fossil sources dominate, representing 89% of the energy composition. Particularly, gas and coal assume crucial roles in electricity generation, while oil serves as the primary fuel for various industrial and transportation purposes. This condition bring positive impact to PT XYZ as an oil gas services company operating in Indonesia. Currently, the company seen an increase in the number of the drilling rigs they serve, with a total of 20 drilling rigs served for both offshore and onshore operations across Indonesia.
The operation requires high availability of equipment to support the job. However, contradictory with the increase operation, there has been a decrease in the availability factor of the equipment used for the service, as shown in figure 1 when the equipment availability is decreasing.
PT XYZ has implemented good preventive maintenance (PM) initiatives to their equipment. These initiatives, such as developing and implementing a comprehensive PM schedule based on running hours/miles and calendar-based maintenance, using condition monitoring technologies, and trained maintenance staff, have helped to increase equipment availability and improve reliability. However, unpredictable problems continue to occur due to several factors leading to equipment breakdown. Equipment breakdown in PT XYZ is categorized into two types that are failed and WMATL (Waiting for Materials) or Down for
Parts (DFP). The percentage of equipment that has been down in waiting for materials for the past two years is increasing, and is exceeding the target in relation to the total available equipment. This calculation involves adding up the number of equipment currently down for repair or maintenance and dividing it by the total number of equipment owned by PT XYZ.
Corrective maintenance (CM) is a reactive approach to equipment maintenance that is performed after a failure has occurred. CM is often necessary, but it can be disruptive and costly. One of the challenges of CM is that it is difficult to predict when and where failures will occur. Another challenge of CM is that it can be difficult to identify the root cause of the failure, which can make it difficult to prevent similar failures from happening in the future. The increasing percentage of equipment that has been down for repair in the past two years at PT XYZ is a concerning trend, because it often caused by long lead time spare parts. This is a major challenge, as it can lead to significant downtime and disruption. When an equipment breaks down and the necessary spare part is not available, PT XYZ may have to wait days, weeks, or months for the part to arrive. This can delay repairs and keep equipment out of service for longer periods of time. This discrepancy calls for a unified approach to ensure efficient and standardize management to tackle this problem.
The rising number of equipment needing repairs at PT XYZ over the past two years is a concerning trend. The problem caused by failed equipment due to operational and waiting for materials or spare parts that not readily available, causing delays in repairs and longer periods of equipment inactivity. To measure and address this issue, the Down for Parts (DFP) Rate is used as a key metric for waiting for materials equipment. It is calculated by dividing the total number of equipment waiting for materials by total equipment. Over the last two years, there has been an average DFP rate that is 3.3% and failed rate that is 1.8%. Our objective for 2023 is to achieve a significantly reduced equipment breakdown rate to KPI 2.6% for DFP. Failing to meet this target could lead to measurable consequences, including extended maintenance lead times, potentially resulting in increased equipment downtime, production losses, and financial repercussions. Given the assumption that each equipment rented to a client generates a monthly revenue of $12,500, we predict that there will be an annual opportunity revenue loss of $600,000, equivalent to $50,000 per month, if on average 4 equipment remain out of service each month due to waiting for materials. In order to tackle this issue, a specialized team has been created to improve the management of parts, with the ultimate goal of minimizing equipment downtime.
The challenge of prolonged lead times for acquiring materials significantly impacting the operational efficiency and agility of the organization. The extended duration required for materials to reach the workshop, compounded by the geographical dispersion of the distribution center and overseas suppliers, has resulted in recurrent delays and disruptions in the maintenance process. This issue not only hinders timely project completion but also escalates operational costs by adding handling cost to $40,000 yearly for expediting, as resources are immobilized, awaiting the arrival of essential new materials. In the context of utilizing refurbished parts as a solution for the long lead time new parts from supplier, emerged as a business issue because it compounded by the absence of standardized guidelines, integrated inventory systems, and a dedicated storage area for refurbished parts, pose critical business challenges. Implementing comprehensive solutions to streamline operations and establish a seamless workflow is pivotal for navigating the intricacies of utilizing refurbished parts in PT XYZ business processes.
THEORETICAL REVIEW
Operation management
Operations management, which is often referred to as production and operation management, encompasses the essential tasks of planning, organizing, implementing, and controlling the operational processes within a company or organization. It includes the management activities that are directly related to the manufacturing of goods and the delivery of services. As an oilfield service company, PT XYZ has an ambition to achieve new levels of efficiency, reliability, and effectiveness in how the company work. Taking operating practices to a higher level, with well-defined organization and processes, based on best practices from other industries. Operations management (OM) is an essential field where the utilization of technologies offers numerous advantages, including enhanced flexibility, reduced costs, improved service quality, increased product customization, and various other benefits. Given the of the industrial revolution and digitalization, it would be beneficial for PT XYZ to incorporate technology into its daily business operations.
Lean
The Lean methodology represents an operational philosophy centered on the identification and reduction of all forms of waste within an organization [9]. Lean also refers to the design of processes aimed at achieving nearly 100% value-added with minimal wasteful. The objective of Lean is to deliver precisely what the customer desires, precisely when they need it, at a profitable cost, devoid of waste, and in a secure manner [1]. Lean is centered around a concept known as "Standard Work," which serves as the fundamental principle of the entire Lean philosophy. Essentially, it involves adhering to a set of established practices that demonstrate the optimal and most effective approach to completing tasks. By embracing Standard Work, organizations ensure that their work processes are reliable, uniform, and unaffected by unnecessary alterations. This promotes a seamless and efficient workflow, ultimately enhancing productivity and reducing waste.
Six Sigma
Six Sigma characterized as a metric, a methodology, and currently, a comprehensive management system. Sigma serves as the yardstick for evaluating process performance and the outcomes of enhancement initiatives, serving as a quality measurement [1]. The Six Sigma methodology extends this metric by incorporating two methodologies for problem analysis and solution endeavors, namely, Define, Measure, Analyze, Improve, and Control (DMAIC), and Define, Measure, Analyze, Design, and Verify (DMADV). Six Sigma strives to reduce process variability and improve the processes according to the customer's quality specifications, achieved through the measurement of process performance and the impact of process changes [9].
Lean Six Sigma
The LSS methodology is a comprehensive operational philosophy implemented throughout the organization, which integrates two improvement methodologies: Lean methods and the Six Sigma approach. The main goal of these methodologies is to reduce inefficiencies and deliver high-quality goods and services [9]. The influence of Lean six sigma (LSS) is increasingly spreading across various industries and sectors. Lean Six Sigma is a problem-solving methodology that uses a problem-solving methodology to define, measure, analyze, improve, and control processes and implement cost-effective solutions that lead to significant financial savings, not only for manufacturing sectors but also to remove defects throughout corporations [8]. Lean Six Sigma is refurbished as a tool in solving production problems that can be established as a turning point in the increase of production, reduce disability products, reduce production costs, reduction production time cycle, increase in market share growth, and customer retention [4]. To improve refurbished parts management at PT XYZ, Lean Six Sigma employs the DMAIC framework (Define, Measure, Analyze, Improve, Control) as a structured approach for process improvement. The DMAIC approach begins with the "Define" phase, which entails the clear identification of project goals and issues, focusing on relevant opportunities aligned with customer needs and significant business benefits. Subsequently, the "Measure" phase collects data and assesses the current process state, followed by the "Analyze" phase to identify root causes. The "Improve" phase is dedicated to developing and implementing solutions, while the "Control" phase establishes measures to sustain improvements. This framework provides a systematic method for driving continuous improvement and sustainable practices in refurbished parts management.
Sigma Level
Sigma Level is a metric specifically designed for analyzing discrete data, particularly outcomes categorized as Pass or Fail [1]. Understanding process quality through the lens of Sigma levels requires examining the concept of defects per million opportunities (DMPO). This metric, where "million" serves as a scaling factor, reflects the frequency of flaws per million potential missteps within a process. Each unit or service delivered presents an opportunity – a chance for customer expectations to fall short. By tracking these opportunities and the rate of defects within them, Sigma levels offer a powerful tool for assessing process quality. Higher Sigma levels signify fewer defects per million opportunities, indicating a process that reliably meets customer needs and delivers consistent value. DPMO will be calculated using the provided formula, which estimates the frequency of deffecs per million opportunities.
Capability Indices
Process capability refers to how well a process can meet its requirements, one method of assessing process capability is by calculating capability indices [1]. Among the diverse capability indices available, Cp and Cpk (or Pp and Ppk) stand out as the most widely employed tools for evaluating process performance against established quality standards. Cp, a potential capability index, captures the inherent process spread, reflecting its theoretical potential to meet specifications if perfectly centered. Complementary to Cp, Cpk emerges as another vital metric in the process capability assessment. Cpk incorporates the crucial element of process location, measured by the mean's closeness to specification boundaries. In two-sided scenarios, the ratio of Cpk to Cp serves as a powerful gauge of process centering. A high Cp value alone doesn't guarantee good quality if the process is off-target. Conversely, a low Cp value can be compensated for by a well-centered process. The ideal scenario lies in a balance of both, where Cp is high and Cpk is close to Cp.
The 8 Waste of Lean
Waste presents itself in various guises, particularly in a production setting. The traditional roster of waste in such an environment comprises several categories. These include manufacturing waste such as people, where valuable talent and skills may be underutilized; delays, encompassing waiting times and lateness in processes; inventory, which represents stock that is not immediately required; facilities, signifying idle machinery and unrefurbished space; transportation, dealing with the movement of parts and materials; motion, which pertains to non-standard, excessive, or unsafe movements; defects, encompassing errors, rework, and scrap; and finally, variation, referring to inconsistent processes and outcomes. Each of these elements represents a facet of waste that can hinder efficiency and productivity in a production environment [5].
RESEARCH METHOD
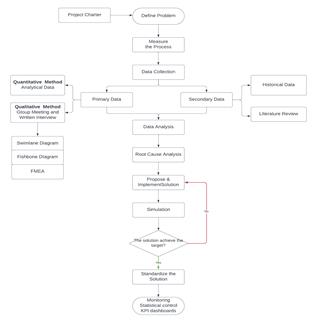
The data collection process for this Final Project will encompass several sources, including a literature review, primary data derived from group meetings and surveys, and secondary data sourced from PT XYZ' historical records. This research uses a mixed methods approach, combining qualitative and quantitative research methodologies. This approach allows for a comprehensive investigation of the updated parts management process in well construction, taking into account numerical performance metrics and contextual insights [2]. Quantitative data is collected from company historical data. Qualitative data is collected through group discussions and descriptive surveys which will be used to obtain data for root cause analysis. Qualitative data will be interpreted to gain a deeper understanding of the factors influencing refurbished parts management practices.
Figure 2: Research methodology (author, 2023)
To overcome existing challenges, the author uses a six sigma framework known as Define, Measure, Analysis, Improve, and Control (DMAIC). To address the challenges at hand, the authors employ the six-sigma framework known as Define, Measure, Analysis, Improve, and Control (DMAIC). The initial step involves identifying the issues through a report that examines the unavailability of equipment and its relation to parts availability. The problem statement, business impact, key metric, and project scope are mapped in project charter. Assessment of the current conditions is carried out using swim lane, which enable the identification of the main bottleneck in the existing process. Once the root cause is determined through the fishbone and pareto chart, the target for improvement is established via Failure Mode Effect Analysis (FMEA) tool. The primary focus of this research is to develop a management system for refurbished parts, one that can be controlled to deliver a business solution
RESULTS AND DISCUSSION
Analysis
In the analysis phase, the author concentrate on crafting a solution that effectively deals with the root cause pinpointed during the define phase. Subsequently, during the improvement phase, the author explores a diverse array of potential solutions to address the identified issues. The suitability of the solution devised in the preceding phase, particularly its readiness for implementation, will be assessed and standardized, while the implementation of improvements will be methodically monitored and adjusted as needed. The measure phase involves understanding the current business process, how it is measured, and its baseline performance. The purpose of this phase is to accurately measure the current condition of the process and collect data related to issues such as time, quality, cost, and quantity. The output of this phase is to determine the current performance and quantify the problems.
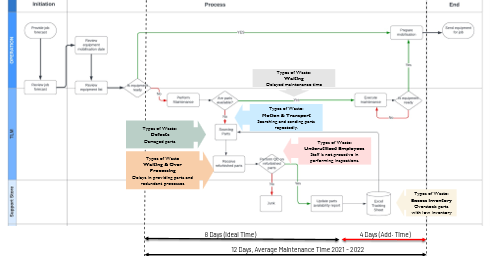
Figure 3: Swimlane of Current Maintenance Process (Author, 2023)
Swimlane (Measure Phase)
Swimlane is a tool that helps confirm the scope described in the Charter and is frequently used to identify potential opportunities for improvements. Each department or team is represented by a horizontal "lane," and the flow of the process is shown by vertical arrows moving across these lanes. Additionally, swim lane diagrams provide valuable insights into potential bottlenecks and inefficiencies, which can guide the implementation of this improvement project. Former process of maintenance in PT XYZ depicted in Figure 3.
Eight Waste of Lean (Measure Phase)
Waste includes activities that consume resources and/or time without adding substantial value [3]. this theory have been modified to suit the maintenance activity domain. The adaptation of the 8 wastes of lean principles for these projects based on the survey and discussion results is detailed in Table 1.
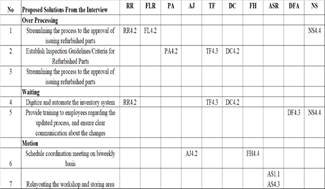
Interpreting The Response (Analysis Phase)
Having listed the answer from the participant, the replies are interpreted, grouped for similarity, and listed. Proses survei melibatkan responden yang masing-masing menjawab pertanyaan. Subsequently, each response is annotated with a unique code, allowing for easy reference to the interpretation, source of the statement, and the result. The coding format follows the pattern [XY, Z].
Table 1: The 8 Waste of Lean Adaptation (Author, 2023)
No
8 Waste
Description
The Activity
1
Overproduction
Producing an excess quantity of a product beyond the requirements of the subsequent process or the final customer
Not applicable
2
Excess Inventory
Any surplus supply beyond what is necessary for each part
Excessive inventory of refurbished parts that lead to storage issues
3
Defects
Any aspect of a product or service that does not align with the requirements. This encompasses inspection, repair, or rework at any stage in the value stream.
Defective or damaged refurbished parts that lead to longer equipment downtime and increased maintenance costs.
4
Over Processing
Any activity that does not contribute value to the product or service that may not be essential or required
Unnecessary or overly complex processes in refurbished parts that can be time-consuming.
5
Waiting
The time spent waiting for a specific event or action to transpire. This waiting time can manifest in various forms, such as human waiting time, machine downtime, or materials awaiting.
Waiting for find the availability of refurbished parts can result in longer equipment downtime.
6
Motion
Unnecessary movement of individuals or information that does not contribute value to the product or service.
Excessive motion or manual handling during parts handling lead to inefficiency.
7
Transportation
Any task that necessitates the movement of parts and materials within a facility.
Unnecessary transportation of parts between locations
8
Underutilized Employees
Do not acknowledge or make use of people's mental, creative, innovative, and physical skills and capabilities to their full potential.
Inefficient processes may underutilize the skills and potential of employees.
According to the respondents, there are four recurring issues when it comes to using refurbished parts. The first concern pertains to the occurrence of defects or damage in these refurbished parts, resulting in extended equipment downtime. The second prevalent problem is the delays experienced in obtaining the required downtime. The third issue involves excessive movement, particularly the time spent searching for parts in various storage areas, causing delays in acquiring the necessary components. Lastly, there is the issue of redundant processes, which require workers to go back and forth to check for parts availability.
Table 2: Interpreted and Grouped Respondent Answer (Author, 2023)
Fishbone Diagram (Analysis Phase)
conjunction with the Fishbone Diagram, which is a methodical brainstorming tool facilitating the identification of potential root causes for undesirable outcomes, the team can elevate their problem-solving process. By using both the 5 Whys and Fishbone Diagram, the team can gain a more comprehensive understanding of the problem by scrutinizing its root causes.
Solution and Proposed Implementation Plan
Swimlane Analysis
In this phase, as detailed in Table 2, the waste are visually represented on a swim lane diagram to illustrate their impact on each functional area.
Operation Team; The operation team encountered waiting and types of waste during equipment downtime, caused by delays in maintenance due to the unavailability or delayed acquisition of refurbished parts.
TLM (Technology Lifecycle Management); The TLM team encountered several forms of waste, such as defects when receiving refurbished parts with defects or suboptimal quality, leading to the necessity for rework or repairs, causing delays and additional costs. Over Processing and motion was observed due to redundant procedures and scattered storage area, resulting from uncertainty about parts and place, which contributed to inefficiencies within the workflow. Additionally, waiting was a challenge during maintenance, involving periods of inactivity while waiting for the arrival of the necessary refurbished parts
Figure 4: Fishbone Diagram of Business Issue (Author, 2023)
Support-Store; The Store team encountered a specific type of waste, namely, Excess Inventory. This waste is primarily a result of poor inventory management, which has led to an excessive accumulation of refurbished parts. This, in turn, requires additional storage space and may even lead to the risk of obsolescence. The waiting waste occurs due to delays in providing refurbished parts to other teams, subsequently resulting in increased equipment
Table 3: Interpreted Solutions Derived from the Survey (Author, 2023)
downtime. And over process indicated on tracking parts that given rise to over-processing waste
Business Solution Alternatives
The respondent’s responses revealed that the most common suggestions were to enhance process efficiency, create inspection guidelines for refurbished parts, and explore potential consolidation or elimination of certain approvals. The third most frequent answer comes from the respondents was to modernize and automate the inventory system, facilitating electronic requests and approvals, thereby minimizing the reliance on physical paperwork and manual interactions.
FMEA (Failure Modes and Effects Analysis)
Failure Mode and Effects Analysis (FMEA) is a crucial technique used to assess and mitigate risks in the management of used parts in PT. XYZ. Through the application of FMEA, this thesis aims to enhance the refurbished parts management process, reducing the likelihood of failures, streamlining workflow and ensuring that PT. XYZ can effectively handle used parts with greater reliability, safety, and cost-effectiveness.
Table 4: FMEA of Down for Parts Maintenance (Author, 2023)
Process
Failure Mode
Failure Effects
SEV
Causes
OCC
Controls
DET
RPN
Long lead time of acquiring refurbished parts
Frequent occurrences of delays in acquiring refurbished parts
Higher maintenance cost
6
Various tracking systems without real-time capability
7
Implement inventory parts management for refurbished parts
7
294
Found damaged parts in the storage area
Delay in maintenance process, Increased downtime costs and time
8
Perception different standard/ criteria of refurbished parts
4
Inspection Guideline, Proper Storage Practices
9
288
Engaging unnecessary motion during the process
Increased processing time
8
No designated storage area
6
Designated area for storage
5
240
Redundant processes in the workflow
Increased complexity, Higher likelihood of errors
6
Historical inventory system obsoleted
7
Workflow, Audits
4
168
Overstock parts
Tied-up capital, Risk of parts becoming obsolete
6
Not having demand forecast
7
Inventory Management System, Demand Forecasting
3
126
Unclear expectations for employees
Lower productivity, Increased defected parts
5
Value of refurbishment has not been effectively communicated
6
Clear Communication, Regular Training
6
180
Excessive transportation/moving
Increased operational costs, Higher risk damage to parts
7
Missing flow or standard of refurbished parts
6
Proper Handling Procedures and SOP
4
168
This table showcases the scores for failure modes and failure effects resulting from the focus group discussion among team members. It also displays the severity (SEV), occurrence (OCC), and detection (DET) ratings, which are used to calculate the risk priority number (RPN) score. The RPN score helps identify areas that require improvement, with the highest score indicating the highest level of risk. According to the table, the damaged parts in the storage area has the highest RPN score of 288, followed by frequent occurrences of delays in acquiring refurbished parts with a score of 294, and engaging unnecessary motion during the process with a score of 240. After discussing with the entire team, it was decided to prioritize these three areas with the highest RPN scores; 1) Frequent occurrences of delays in acquiring refurbished parts, 2) Damaged parts in the storage area, 3) Engaging unnecessary motion during acquiring refurbished parts.
Justification of Implementation Plan
Designing Solution for Root Causes
In the pilot test plan, we have outlined different scenarios, each representing a specific set of changes in our processes. The baseline scenario reflects PT XYZ former operational state, while Scenario 1, Scenario 2, and Scenario 3 represent incremental changes. The scenario contributed to these significant findings are; a) Baseline (No Modification), b) Using Maximo for Inventory Management, c) Scenario 1 (adding inspection criteria for refurbished parts), d) Scenario 2 (Relayouting storage area), e) Scenario 3 (Dedicated refurbished parts area). Each of these simulation levels was designed and executed to not only identify the potential impact on Maintenance Time (Turn Around Time, TAT) but also to provide concrete solutions for the root causes, to systematically assess the impact of each proposed change on our operational efficiency, particularly in terms of inventory management, inspection procedures, layout optimization, and storage practices for refurbished parts.
Table 5: Pilot Test Result (Author, 2023)
TAT Days
Defect
Distance
Invest
DFP%
Baseline
11
33
70m
-
3,3%
Scenario 1
10
17
70m
$400k
2,99%
Scenario 2
9
15
30m
$425K
2,74%
Scenario 3
7,5
13
20m
$475K
2,452%
The pilot test successfully demonstrated the potential for improving refurbished parts management. All scenarios were able to reduce the average maintenance time compared to the baseline. However, the extent of improvement varied depending on the implemented approach.
Improvement
Histograms
In the case presented, the baseline histogram in figure 6 reveals a broad distribution with significant variability, indicating a lack of control. The process capability indices (Cp=0.48) and Cpk (-0.37) further confirm this, highlighting the need for intervention.
Scenario 3 demonstrates the effectiveness of the improvement. The histogram displays a narrower distribution, implying decreased variability and enhanced stability of the process. The positive change is also evident in the increased Cp and Cpk values, which rise to 1.9 and 1.3 respectively. Additionally, the sigma level rose from 1.5 to 2.9, indicating that the process can now consistently produce parts within acceptable tolerances.
Figure 7: Histogram After Improvement (Author, 2023)
By analyzing the shift in the histogram and associated metrics, we can conclude that the implemented control measures in Scenario 3 have successfully addressed process variability and achieved greater control over the refurbished parts production process. This ultimately leads to improved quality, reduced defect rates, and enhanced overall performance.
DPMO (Defects Per Million Opportunity)
A lower DPMO value signifies a higher level of process capability and efficiency, aligning with the Six Sigma goal of minimizing defects to an exceptionally low level.
Table 6: DPMO Scenarios (Author, 2023)
Scenario
Defects
Opportunities
Defects per Opportunity
DPMO
Baseline
33
226
0.1460
146018
Scenario 1
17
226
0.0752
75221
Scenario 2
15
226
0.0664
66372
Scenario 3
13
226
0.0575
57522
In the above table, the 'Defects per Opportunity' column represents the ratio of defects of refurbished parts to target, while the 'DPMO' column is derived by multiplying the 'Defects per Opportunity' by 1,000,000. These DPMO values offer a standardized and comparable assessment of the quality performance across different scenarios. Lower DPMO values in each scenario after simulation indicate higher process quality and efficiency, reflecting the success of quality improvement efforts.
Significantly, the interpolation indicates that there is a considerable rise in the Sigma Level after improvement. It goes from the initial value of 2.5 to an interpolated value of 3.1. This demonstrates a noteworthy improvement in the overall quality of the process, showing commendable progress towards greater efficiency.
Implementation Plan
The Table 8 lists the implementation plan for the approved new refurbished parts process.
Table 7: DPMO Scenarios to Sigma Level (Author, 2023)
Scenario
DPMO
DPMO1
Sigma Level 1
Interpolated Sigma Level
Baseline
146018
158655
2.5
2502
Scenario 1
75221
80757
2.9
~2.899
Scenario 2
66372
66807
3
3
Scenario 3
57522
54799
3.1
~3.080
Table 8: Implementation Plan (Author, 2023)
Task
Person In Charge
NOV '23
DEC '23
JAN '24
FEB '24
March '24
April '24
Provide training to staff related inspection for refurbished parts
Production Planner TLM
ꙩ
ꙩ
Assessing area for dedicated storage area in other workshops
TLM and Store Team
ꙩ
ꙩ
Items ordering for dedicated storage area
ꙩ
Schedule coordination meeting regularly
Production Planner
ꙩ
ꙩ
Socializing new workflow of refurbished parts
TLM Manager
ꙩ
ꙩ
Implementation new workflow of refurbished parts
ꙩ
ꙩ
CONCLUSION
The findings of this research demonstrate that all implemented scenarios, to varying degrees, achieved improvements in refurbished parts management compared to the baseline. Scenario 1, focusing on enhanced inventory management, led to moderate reductions in maintenance time and defect rate, highlighting the importance of accurate inventory control. Scenario 2, streamlining the inspection process, yielded further improvements in both metrics, demonstrating the effectiveness of standardized inspection procedures for early defect detection. Notably, Scenario 3, following improvement in scenario 1 and 2 and continue to establishing a dedicated area for refurbished parts, achieved the most significant reduction in defect rate while requiring the highest investment. This suggests that dedicated environments can significantly enhance quality but come with substantial upfront costs.
The identified root causes of inefficiencies in refurbished parts management at PT XYZ have been meticulously addressed through targeted improvement initiatives. The primary objective of achieving a Down for Parts (DFP) rate of 2.6% by the end of 2023 has not only been met but surpassed, with the DFP rate successfully reduced to an impressive 2.45%. This reduction is accompanied by a noteworthy decrease in the average equipment downtime from 11 to 8 days.
Furthermore, the utilization of Six Sigma principles showcased a significant improvement, as evidenced by the rise in the Sigma Level for equipment downtime or maintenance day from 1.5 to a heightened level of 2.9. This factual information solidifies the efficiency of Six Sigma approaches in reducing variation and improving the quality of the refurbished parts management system.
By tackling the challenges in managing refurbished parts, the study offers actionable insights with broad applicability across industries. The strategic implementation of the DMAIC methodology within the Lean Six Sigma framework has not only optimized the maintenance processes but also substantially minimized equipment downtime. The systematic approach to materials management efficiency provides a bridge between theoretical insights and practical solutions in the realms of equipment maintenance and materials management.
RECOMMENDATIONS
Combining the strengths of all three scenarios can create a synergistic effect, optimizing inventory control, inspection procedures, and dedicated storage. Establish a specific Key Performance Indicator (KPI) for defects arising from refurbished parts and utilize the KPI as a benchmark for success, ensuring the reliability of refurbished parts in Well Construction. While Scenario 3 incurred higher upfront costs, the substantial reduction in defect rates justifies the investment. Consider expanding dedicated storage areas to further enhance quality. While Scenario 3 incurred higher upfront costs, the substantial reduction in defect rates justifies the investment. Consider expanding dedicated storage areas to further enhance quality. The success of Scenario 3 in achieving process stability emphasizes the importance of continuous monitoring. Implement a robust monitoring system and promptly adjust procedures based on real-time data. Equip employees with the necessary skills to adapt to refined processes. Training programs can enhance awareness and adherence to standardized guidelines. Conduct a comprehensive cost-benefit analysis for each improvement scenario to optimize resource allocation and ensure long-term sustainability.
REFERENCE
McCarty, T. R., Daniels, L., Bremer, M., Gupta, P. K., Heisey, J. K., & Mills, K. A. (2004). The Six Sigma Black Belt Handbook. http://digilib.umpalopo.ac.id:8080/jspui/bitstream/123456789/76/1/%5bsharelp.com%5d641%20The%20Six%20Sigma%20Black%20Belt%20Handbook.pdf
BP. (2021) Statistical Review of World Energy. BP, 69.. Retrieved June 22, 2023, from https://www.bp.com/content/dam/bp/business-sites/en/global/corporate/pdfs/energy-economics/statistical-review/bp-stats-review-2021-full-report.pdf
Creswell, J. W., & Creswell, J. D. (2018). Research Design: Qualitative, Quantitative, and Mixed Methods Approaches. SAGE Publications, Incorporated.
Institute, P. M. (2021). A Guide to the Project Management Body of Knowledge (PMBOK® Guide) – Seventh Edition and The Standard for Project Management (ENGLISH). Project Management Institute.
Kurnia, H., & Purba, H. H. (2021). A Systematic Literature Review of Lean Six Sigma in Various Industries. Journal of Engineering and Management in Industrial System Vol. 9 No. 2 Year 2021, 9(2), 19–30. https://doi.org/10.21776/ub.jemis.2021.009.02.3
Pyzdek, Thomas (2003). The Six Sigma Handbook, United States of America, McGraw-Hill.
Rahman, A., Richards, R., Dargusch, P., & Wadley, D. (2023). Pathways to reduce Indonesia’s dependence on oil and achieve longer-term decarbonization. Renewable Energy, 202, 1305–1323. https://doi.org/10.1016/j.renene.2022.11.051
Singh, M., & Rathi, R. (2019). A structured review of Lean Six Sigma in various industrial sectors. International Journal of Lean Six Sigma, 10(2), 622–664. https://doi.org/10.1108/ijlss-03-2018-0018
Voehl, F., Harrington, H. J., Mignosa, C., & Charron, R. (2013b). The Lean Six Sigma Black Belt Handbook: Tools and Methods for Process Acceleration. https://www.amazon.com/Lean-Sigma-Black-Belt-Handbook/dp/1466554681
License
Creative Commons Attribution-NonCommercial-NoDerivatives 4.0 International License
All papers should be submitted electronically. All submitted manuscripts must be original work that is not under submission at another journal or under consideration for publication in another form, such as a monograph or chapter of a book. Authors of submitted papers are obligated not to submit their paper for publication elsewhere until an editorial decision is rendered on their submission. Further, authors of accepted papers are prohibited from publishing the results in other publications that appear before the paper is published in the Journal unless they receive approval for doing so from the Editor-In-Chief.
Himalayan Journal of Economics and Business Management open access articles are licensed under a Creative Commons Attribution-Share A like 4.0 International License. This license lets the audience to give appropriate credit, provide a link to the license, and indicate if changes were made and if they remix, transform, or build upon the material, they must distribute contributions under the same license as the original.
Advertisement
Recommended Articles
Research Article
Influence of Leadership on Poverty Reduction in the Devolved Government in Trans-Nzoia County, Kenya
Kinisu Sifuna,
...
Peter Simotwo
Published: 30/06/2021
Download PDF
Cite
x
APA
Sifuna, K., Lwangale, D. W., Simotwo, P., Sifuna, K., Lwangale, D. W. & Simotwo, P. (2021). Influence of Leadership on Poverty Reduction in the Devolved Government in Trans-Nzoia County, Kenya. Himalayan Journal of Economics and Business Management, 2(1), None-None.
MLA
Sifuna, Kinisu, et al. "Influence of Leadership on Poverty Reduction in the Devolved Government in Trans-Nzoia County, Kenya." Himalayan Journal of Economics and Business Management 2.1 (2021): None-None.
Chicago
Sifuna, Kinisu, David W. Lwangale, Peter Simotwo, Kinisu Sifuna, David W. Lwangale and Peter Simotwo. "Influence of Leadership on Poverty Reduction in the Devolved Government in Trans-Nzoia County, Kenya." Himalayan Journal of Economics and Business Management 2, no. 1 (2021): None-None.
Harvard
Sifuna, K., Lwangale, D. W., Simotwo, P., Sifuna, K., Lwangale, D. W. and Simotwo, P. (2021) 'Influence of Leadership on Poverty Reduction in the Devolved Government in Trans-Nzoia County, Kenya' Himalayan Journal of Economics and Business Management 2(1), pp. None-None.
Vancouver
Sifuna K, Lwangale DW, Simotwo P, Sifuna K, Lwangale DW, Simotwo P. Influence of Leadership on Poverty Reduction in the Devolved Government in Trans-Nzoia County, Kenya. Himalayan Journal of Economics and Business Management. 2021 Jan;2(1):None-None.
Download PDF
Research Article
The impact of organizational flexibility on improving institutional performance in Iraqi business organizations
Muntaha Abdul Hassan Salih
Published: 22/01/2026
Download PDF
Cite
x
APA
Salih, M. A. H. (2026). The impact of organizational flexibility on improving institutional performance in Iraqi business organizations. Himalayan Journal of Economics and Business Management, 7(1), 1-9.
MLA
Salih, Muntaha A. H.. "The impact of organizational flexibility on improving institutional performance in Iraqi business organizations." Himalayan Journal of Economics and Business Management 7.1 (2026): 1-9.
Chicago
Salih, Muntaha A. H.. "The impact of organizational flexibility on improving institutional performance in Iraqi business organizations." Himalayan Journal of Economics and Business Management 7, no. 1 (2026): 1-9.
Harvard
Salih, M. A. H. (2026) 'The impact of organizational flexibility on improving institutional performance in Iraqi business organizations' Himalayan Journal of Economics and Business Management 7(1), pp. 1-9.
Vancouver
Salih MAH. The impact of organizational flexibility on improving institutional performance in Iraqi business organizations. Himalayan Journal of Economics and Business Management. 2026 Jan;7(1):1-9.
Download PDF
Research Article
Modelling Structure Job Quality, Job Design and Job Satisfaction
Moch Nurhadi,
...
Avi Sunani
Published: 30/08/2022
Download PDF
Cite
x
APA
Nurhadi, M., Bisyri Effendi, M., Saiful Ulum, A. & Sunani, A. (2022). Modelling Structure Job Quality, Job Design and Job Satisfaction. Himalayan Journal of Economics and Business Management, 3(2), 1-4.
MLA
Nurhadi, Moch, et al. "Modelling Structure Job Quality, Job Design and Job Satisfaction." Himalayan Journal of Economics and Business Management 3.2 (2022): 1-4.
Chicago
Nurhadi, Moch, Moch Bisyri Effendi, Achmad Saiful Ulum and Avi Sunani. "Modelling Structure Job Quality, Job Design and Job Satisfaction." Himalayan Journal of Economics and Business Management 3, no. 2 (2022): 1-4.
Harvard
Nurhadi, M., Bisyri Effendi, M., Saiful Ulum, A. and Sunani, A. (2022) 'Modelling Structure Job Quality, Job Design and Job Satisfaction' Himalayan Journal of Economics and Business Management 3(2), pp. 1-4.
Vancouver
Nurhadi M, Bisyri Effendi M, Saiful Ulum A, Sunani A. Modelling Structure Job Quality, Job Design and Job Satisfaction. Himalayan Journal of Economics and Business Management. 2022 Jul;3(2):1-4.
Download PDF
Research Article
Accountability and Transparency of Village Fund Management in Lumajang District
Nurina Ayuningtiyas,
...
Muhammad Miqdad
Published: 28/12/2023
Download PDF
Cite
x
APA
Ayuningtiyas, N., Santosa Putra, H. & Miqdad, M. (2023). Accountability and Transparency of Village Fund Management in Lumajang District. Himalayan Journal of Economics and Business Management, 4(2), 1-4.
MLA
Ayuningtiyas, Nurina, Hendrawan Santosa Putra and Muhammad Miqdad. "Accountability and Transparency of Village Fund Management in Lumajang District." Himalayan Journal of Economics and Business Management 4.2 (2023): 1-4.
Chicago
Ayuningtiyas, Nurina, Hendrawan Santosa Putra and Muhammad Miqdad. "Accountability and Transparency of Village Fund Management in Lumajang District." Himalayan Journal of Economics and Business Management 4, no. 2 (2023): 1-4.
Harvard
Ayuningtiyas, N., Santosa Putra, H. and Miqdad, M. (2023) 'Accountability and Transparency of Village Fund Management in Lumajang District' Himalayan Journal of Economics and Business Management 4(2), pp. 1-4.
Vancouver
Ayuningtiyas N, Santosa Putra H, Miqdad M. Accountability and Transparency of Village Fund Management in Lumajang District. Himalayan Journal of Economics and Business Management. 2023 Jul;4(2):1-4.
Hakiki, N. & Hanafi, M. (2023). Quality Improvement of Refurbished Parts through Lean Six Sigma Framework (Case PT XYZ: Oil and Gas Services Company). Himalayan Journal of Economics and Business Management, 4(2), 1-9.
MLA
Hakiki, Nuraida and Muhammad Hanafi. "Quality Improvement of Refurbished Parts through Lean Six Sigma Framework (Case PT XYZ: Oil and Gas Services Company)." Himalayan Journal of Economics and Business Management 4.2 (2023): 1-9.
Chicago
Hakiki, Nuraida and Muhammad Hanafi. "Quality Improvement of Refurbished Parts through Lean Six Sigma Framework (Case PT XYZ: Oil and Gas Services Company)." Himalayan Journal of Economics and Business Management 4, no. 2 (2023): 1-9.
Harvard
Hakiki, N. and Hanafi, M. (2023) 'Quality Improvement of Refurbished Parts through Lean Six Sigma Framework (Case PT XYZ: Oil and Gas Services Company)' Himalayan Journal of Economics and Business Management 4(2), pp. 1-9.
Vancouver
Hakiki N, Hanafi M. Quality Improvement of Refurbished Parts through Lean Six Sigma Framework (Case PT XYZ: Oil and Gas Services Company). Himalayan Journal of Economics and Business Management. 2023 Jul;4(2):1-9.