Agropolitan is expected to increase farmer’s welfare and share of agricultural sector to gross regional domestic product (GRDP). The aims of this study are to determine the pattern of agricultural commodities in Kuningan Regency based on spatial autocorrelation and to determine agropolitan district which can be developed based on cluster analysis and outlier analysis. These studies rely on secondary data and analyze with LQ and spatial analysis autocorrelation. Based on the results, LQ of rice is relatively uniform. Only four districts are included in the cluster of high rice production while the rest of regions can serve as a buffer region. LQ values of sweet potatoes are relatively concentrated in Kuningan District and are clustered as High High values for some regions. However, there are areas with LQ> 1 which serve as a buffer area. There are 14 districts in Kuningan which have LQ value of cloves > 1. Unfortunately only four districts are categorized in the production of high clusters of cloves while other areas act as a buffer. There are eight districts in Kuningan which have Palm sugar LQ > 1. However only three districts are categorized as the high cluster of palm production, while other areas act as a buffer.
Keywords
Location Quotient (Lq)
Cluster Analysis
Agropolitan
Spatial Autocorrelation
INTRODUCTION
The concept of regional development planning which is quite popular in several decades in developing and agrarian countries such as Indonesia, is the concept of agropolitan development. The development of the Agropolitan Area aims to increase the income and welfare of the community through accelerating regional development and increasing the attachment of villages and cities [1]. Agropolitan area consists of agricultural towns and villages of agricultural production centers. This area is not limited by government administrative boundaries village, sub-district and district. Adjusted to the economic scale of the region so that it is felt more flexible. Thus, the shape and area of the Agropolitan Area may include one village, sub-district, or several sub-districts within one Regency area. This area can also include areas that penetrate the territory of other visiting regencies/cities.
Kuningan Regency has great potential in the agricultural sector; the area of agricultural land in 2019 was 69,879 Ha in the form of 29,046 hectares of rice fields and 40,833 hectares of non-rice fields. semi-technical irrigation, 2007 Ha simple irrigation; 5,646 Ha of village irrigation and 7,856 Ha of rainfed rice fields. On average, paddy fields can be planted two to three times a year, and have an average productivity of 56.86 quintals/ha (paddy rice). The great potential of agriculture encourages the Kuningan Regency government to maximize the agricultural sector through several local government programs. Determination of the priority commodities of food crops in the agropolitan area of Bojonegoro Regency found that rice and soybeans were the priority commodities for development in the agropolitan area [2]. One of the programs implemented is the application of the agropolitan concept in Kuningan Regency.
Simanjuntak [3] says that the agropolitan concept is expected to be able to boost the welfare level of farmers and increase the share of the agricultural sector as a whole to the gross regional domestic product (GDP). In supporting the application of the Agropolitan concept, the Kuningan Regency government plans to develop supporting districts spread across the Kuningan Regency area. The division of agropolitan development districts was followed up with agropolitan development programs in each district, as well as the preparation of more detailed program implementation plans for priority districts. Each district is directed to produce superior products that can be developed, so that areas that are suitable for the development of certain commodities can be clustered. The concept of clustering is based on agglomeration (concentration of activity), because in the agropolitan concept each district formed ultimately supports activities in a wider area. In developing clusters of agricultural production areas, spatial and economic considerations need attention. Spatially, districts that are determined to produce certain superior commodities need to have uniformity in their production characteristics. Apart from that, from the economic aspect, the development of superior commodities is one of them considering the element of Location Quotient (LQ). Location Quotient according to Tarigan [4] is a comparison of the size of the role of a sector/industry in a region to the size of the role of a sector/industry nationally. The analytical technique for identifying economic concentrations relative to a broader or more concise reference location is called economic basis analysis.
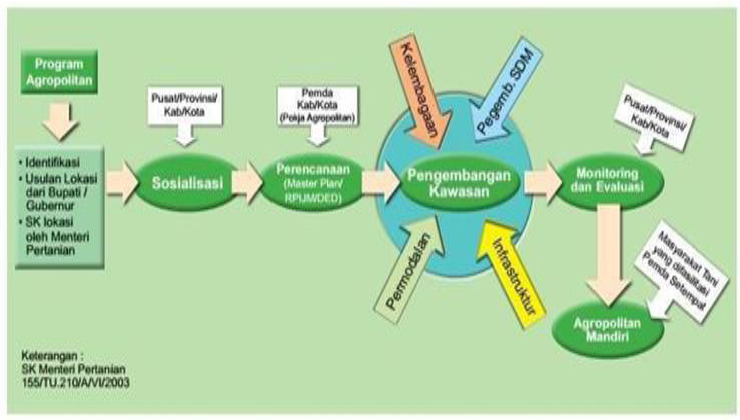
To see the spatial and economic linkages in determining the main commodities in each district, a mapping process was carried out on the distribution of some of the leading agricultural commodities in Kuningan Regency which consisted of food crops and plantation crops. The food crops analyzed were rice and sweet potatoes which are one of the leading commodities in Kuningan Regency. As for plantation crops, selected commodity sugar palm and cloves. Each commodity is calculated on the Location Quotient (LQ) and Localization Index (LI) values and identified spatial relationship patterns using spatial autocorrelation values. From the two instruments, it is hoped that certain districts will be formed with several superior commodities in each region. This study aims to identify patterns of distribution of agricultural commodities (rice, sweet potato, palm sugar, cloves) in Kuningan Regency based on spatial autocorrelation and determine which Agropolitan districts can be developed based on the results of the Cluster and Outlier Analysis (Figure 1).
Figure 1: Agropolitan Implementation Mechanism
MATERIALS AND METHODS
This research was conducted in Kuningan Regency. The data collection stage was carried out by taking secondary data from BPS (Central Statistics Agency) Kuningan Regency. The data taken is the 2020 Kuningan in Figures data which contains agricultural production data for several commodities in each sub-district in Kuningan Regency. The commodity data used are rice, sweet potato, clove and palm sugar, as well as administrative area data in Kuningan Regency.
Analysis Method
In general, this research uses several features in ArcGIS software that support the expected output from the analysis results. Some of the functions used include;
The join function, to combine attribute data on rice production and LQ data with attribute data on the administrative map which only contains information on the name of the district
The calculation of LQ and LI values is carried out using Microsoft Excel software
Spatial autocorrelation function
Cluster function and outlier analysis
The query function is performed to bring up the final map view of the combined results of the cluster analysis and LQ
Map layout process
Spatial Autocorrelation and Cluster Analysis
The next step is to analyze the data that has been obtained. In data analysis there are steps that must be taken. The first step taken in analyzing the data is to calculate the Moran index from the available data. Moran's index can be calculated with the help of ArcGIS 10 software. The file type used in data processing is SHP (Shape File) which is a base map from the Central Bureau of Statistics with administrative boundaries. The attribute data on the base map is then joined with attribute data regarding the production of agricultural commodities in each sub-district. The data used for spatial autocorrelation analysis here is production data, not productivity data. Lembo [5] suggests a spatial autocorrelation analysis showing the form of a region's linkage with only one indicator. Spatial autocorrelation measurements using the global Moran Index are formulated by Patrick Moran as follows [6-7]:
Where:
: value of agricultural production in district i
: average value of agricultural production
: Value of agricultural production in district j
N : number of samples
: spatial neighbor matrix
Where is the average of observations and weighing the linkages between regions i and j.
In testing the resulting Moran I Index output, the following hypotheses can be used:
H0 = No Spatial Autocorrelation
Ha = There is Spatial Autocorrelation
If the Z(I) value is > Zα/2 or -Z(I) < -Zα/2, it can be concluded that there is a significant regional association at the α significance level. The range of values of the Moran Index in the case of a standardized spatial weighting matrix is -1 ≤ I ≤ 1. The value of -1 ≤ I < 0 indicates a negative spatial autocorrelation, while a value of 0 < I ≤ 1 indicates a positive spatial autocorrelation, the Moran Index value is zero indicates no group. The magnitude of spatial autocorrelation can be used to identify spatial relationships [8]. Often, adjacent sub-districts have similar characteristics or indicators. So, there is a correlation in space or place, not a correlation between data from one time to another.
The next step is to determine whether there is a spatial autocorrelation in the production of rice, sweet potato, clove and sugar commodities by conducting a significance test. If in the significance test there is a spatial autocorrelation, the next step is to determine the form of a positive or negative spatial autocorrelation. This spatial autocorrelation is the basis for the establishment of a leading commodity-producing district in Kuningan Regency. Furthermore, a mapping with cluster analysis was made to show the spatial distribution of the commodity production. In cluster analysis and autocorrelation, in addition to conceptualizing spatial relationships. It is also necessary to select the identification distance used for the calculation. The concept of distance in the autocorrelation and cluster analysis is the Euclidean distance and the Manhattan distance. The neighboring concept chosen has an effect on the type of distance calculation. In this study, the concept of neighboring based on polygon contiguity is used. using the Euclidean distance concept.
Base Sector Analysis and Concentration of Activities
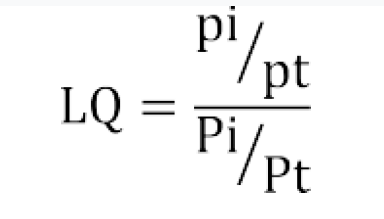
The calculation of LQ and LI is a complement and justification for the results of the spatial autocorrelation analysis and cluster analysis. The clustered regions were then combined with attribute data with LQ and LI values. After that, the final mapping process is carried out which creates a map of the distribution of LQ values which includes statistical and spatial clustering of certain commodities that can be used as agropolitan districts. LQ analysis is used to determine food crops sub-sector commodities that have a comparative advantage, with LQ criteria>1. Operationally, the LQ formulation can be formulated as follows [9]
Where:
pi = area harvested for commodity i at the sub-district level
pt = total area harvested for all commodities at the sub-district level
Pi = total area harvested for commodity i at district level
Pt = total commodity harvested area at district level
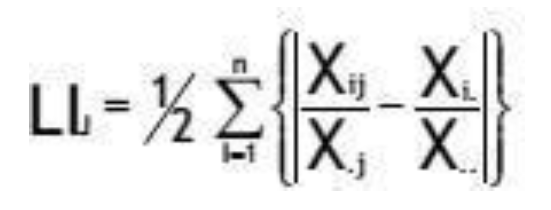
The Localization Index is an index that describes the relative concentration of an activity compared to the total trend within the region. Generally, this index is used to determine the percent distribution of a particular activity within the region [10]. In general, this analysis is used to determine areas that have the potential to develop certain activities. This LI equation can be said to be part of the LQ.
To interpret the results of the Localization Index analysis, it is generally used
If the value is close to 0 it means that the development of an activity tends to have the same level as the development of a wider area. The level of activity development will be relatively indifferent across locations. This means that these activities have the same relative level of development opportunities in all locations
If the value is close to 1, the observed activity will tend to develop concentrated in one location. This means that the observed activities will develop better if they are carried out in certain locations
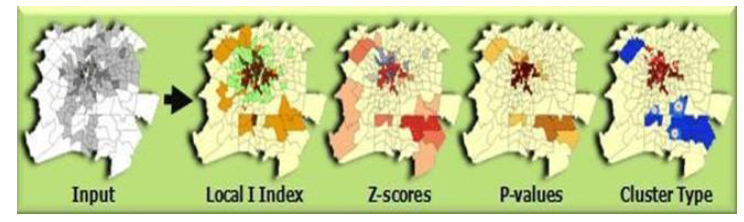
Cluster and outlier analysis identifies patterns of values contained in attributes to find hot spots, cold spots and spatial outliers using Anselin Local Moran's I. The analysis results from this function generate new features with attributes that are used as feature inputs. Local Moran's I Index values, z-scores, p-values, and cluster/outlier types. Payung et al. [11] stated that the z-value and p-value have the same interpretation as the spatial autocorrelation analysis which serves to reject the null hypothesis. The interpretation for the decision to reject and accept the null hypothesis in this analysis is described as follows (Figure 2):
Figure 2: Illustration of Cluster and Outlier Analysis
A large and positive z value indicates that the features included in the analysis have the same value (high or low). The clustering for each region is HH for regions with high value characteristics and LL for regions with low value characteristics
A small and negative z value indicates that the features included in the analysis are identified as spatial outliers. HL indicates that the area is of high value and surrounded by areas of low value. Meanwhile, LH shows that the area is of low value and surrounded by high value areas
RESULTS
Rice Commodity Analysis
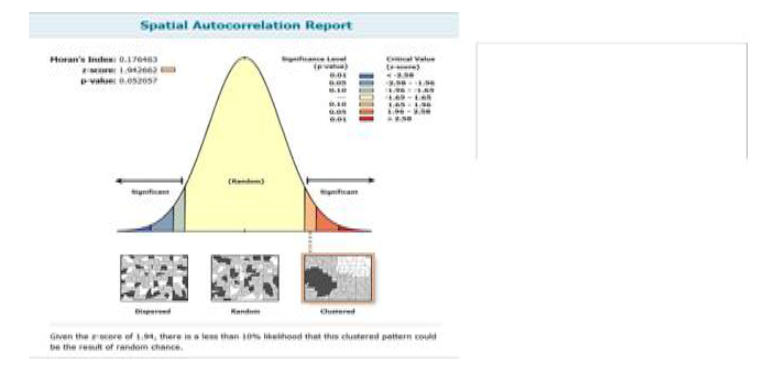
From the results of statistical calculations for the spatial autocorrelation of rice commodities, it can be seen that rice commodities have a weak clustering tendency with an error rate of 10%. Moran's index value (0.176463) is closer to zero than one, therefore the clustering pattern that occurs can be said to be quite weak even though it is statistically significant (Figure 1, Table 1).
Table 1: Spatial Autocorrelation Results Based on Moran’s I Statistics
Moran's Index:
0.176463
Expected Index:
-0.032258
Variance:
0.011543
z-score:
1.942662
p-value:
0.052057
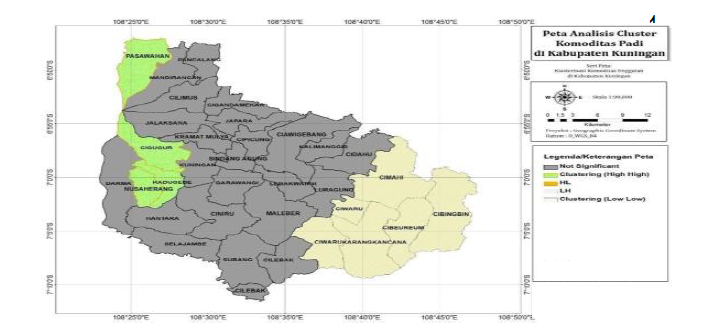
The clustering pattern formed is then further analyzed using the cluster function and outlier function analysis to get a spatial description of which areas have the potential to become rice commodity development districts in supporting the application of the agropolitan concept in Kuningan Regency. Based on the results of the cluster analysis (Figure 4), it was found that the areas included in the High High (HH) cluster consisted of 4 sub-districts. This indicates that the region is an area with high rice production and its surroundings (neighbors among the 4 sub-districts) also have high scores. These four sub-districts are administratively located in the Kuningan Regency area in the North and West which are close to Mount Ciremai.
The results of cluster analysis for rice commodities, combined with economic-based data (LQ calculations) for comparison
Figure 3: Results of Spatial Autocorrelation Analysis of Rice Production
Figure 4: Map of Rice Production Cluster Analysis
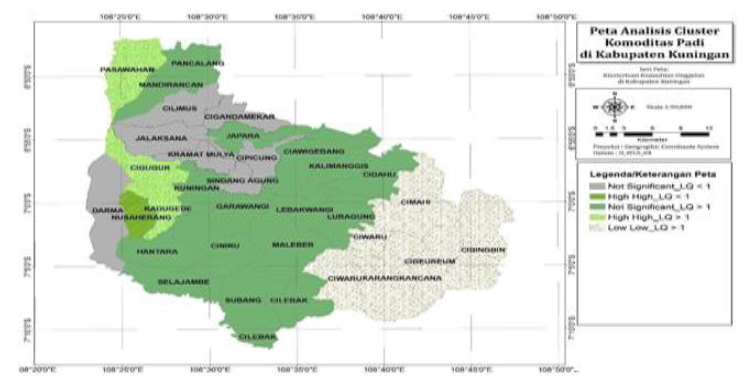
Figures 4 and 5, it can be explained that the level of development of rice commodities in Kuningan Regency is relatively uniform when viewed from the LQ value. Of the 32 sub-districts in Kuningan Regency, only 7 sub-districts have the LQ value for rice less than 1, the majority of which are in the Cilimus District. In other words, there is an indication of the concentration of rice production activities in the sub-district (sub-district). analysis. The results of the LQ calculation for food crops, obtained that rice is the leading commodity or base commodity in the area with a value of 1.13, while the other two commodities, namely corn and cassava are a support and not a leading commodity with LQ values of 0.09 and 0.03 [12]. If equipped with the LI value, the LI value for rice is 0.11 then it can be said that the development of a rice production activity tends to have the same level as the development of a wider area. Thus the High High cluster in Kuningan District can be the main driver of rice production in Kuningan District, while other areas can serve as a buffer.
Figure 5: Map of Rice Clusters and LQ Values for each District
Sweet Potato Commodity Analysis
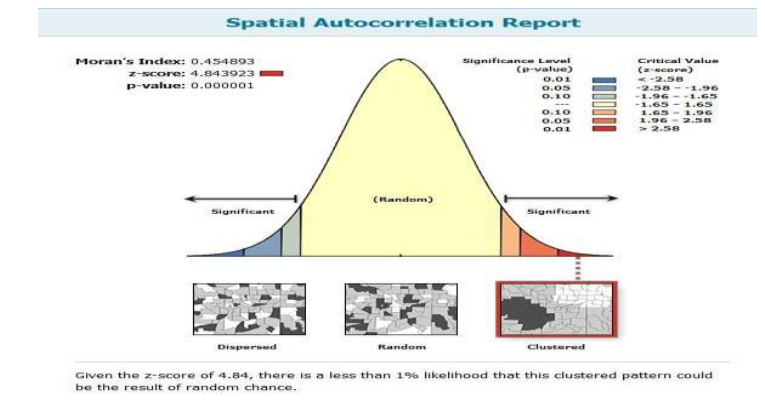
The relative position of Kuningan Regency in sweet potato production in West Java Province is quite good. Kuningan Regency is the main sweet potato producer in West Java province. With this potential, the development of sweet potato commodities through the agropolitan concept is a good choice. First, it is necessary to look at the spatial statistics of areas that have the potential to be used as sweet potato production clusters in order to facilitate the development of an agropolitan district. From the results of statistical calculations for the spatial autocorrelation of sweet potato commodities, it can be seen that sweet potato commodities have a fairly good clustering tendency with an error rate of 1%. Moran's index value (0.454) even though it is in the middle between zero and one, indicates the clustering pattern that occurs is quite strong and statistically significant ( Table 2, Figure 6).
Table 2: Evaluation of Spatial Dependence Through Moran’s I Statistic
Moran's Index
0.454893
Expected Index
-0032258
Variance:
0.010114
z-score:
4.843923
p-value:
0.000001
Figure 6: Results of Spatial Autocorrelation Analysis of Sweet Potato Commodities
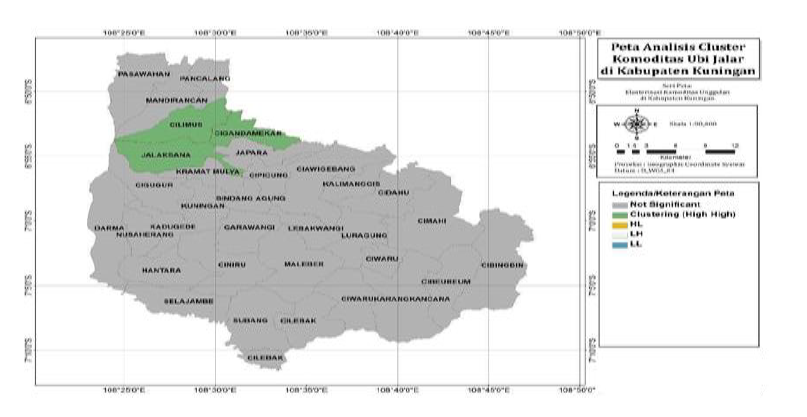
Based on the results of the cluster analysis (Figure 7), it was found that the areas included in the High High (HH) cluster consisted of 3 sub-districts. This indicates that the region is an area with high sweet potato production and its surroundings (neighbors among the 3 sub-districts) also have high scores. These three sub-districts are administratively located in the Kuningan Regency area in the north. All sub-districts in the High High cluster are part of the Cilimus District. The regional regulation stipulates that Cilimus District has superior commodities, one of which is sweet potato. The results of the cluster analysis confirmed that the sweet potato commodity is one of the right commodities to be developed in this district, because spatially the distribution of rice production is positively correlated.
Figure 7: Map of Sweet Potato Production Cluster Analysis
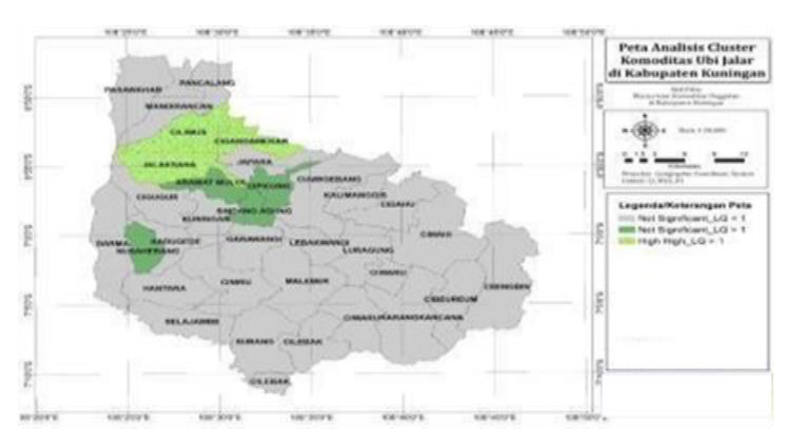
From the map in Figure 8, it can be explained that the level of development of sweet potato commodities in Kuningan Regency is relatively concentrated when viewed from the LQ value. Of the 32 sub-districts in Kuningan Regency, only 8 sub-districts have the LQ value for sweet potatoes more than 1, the majority of which are in the Cilimus District and only one is outside the Cilimus District (Nusaherang District). An LQ value > 1 indicates an indication of the concentration of sweet potato production activities in the sub-district (sub-district), or it can also be translated that a sub-district that has an LQ value > 1 has the potential to export sweet potato production to other areas because its production is relatively above average. production in the entire coverage area of the analysis. If equipped with the LI value, the LI value for sweet potato is 0.49, the value is in the middle between 0 and 1, it can be said that the development of an observed sweet potato production activity will tend to develop concentrated in one location. This means that the observed activities will develop better if they are carried out in certain locations. With the sweet potato LQ value being relatively concentrated in Kuningan Regency and the High High cluster value for several regions, it is appropriate to determine the area in the Cilimus District as a sweet potato production center. Although there are still areas with an LQ value>1 in other sub-districts, the development direction is prioritized in the Cilimus District area with sub-districts outside the Cilimus District functioning as a buffer.
Figure 8: Map of Sweet Potato Clusters and LQ Values for each District
Clove Commodity Analysis
Clove is one of the plantation commodities that has a fairly high price even though it is an annual crop. In terms of position relative to other regions, Kuningan Regency is not the main center of clove production. However, to assist in the analysis process, clove plantation commodities were selected to describe the potential distribution of their production in Kuningan Regency.
From the results of statistical calculations for the spatial autocorrelation of clove commodities, it can be seen that clove commodities have a fairly good tendency to cluster with an error rate of 1%. Moran's index value (0.410) even though it is in the middle between zero and one, indicates the clustering pattern that occurs is quite strong and statistically significant.
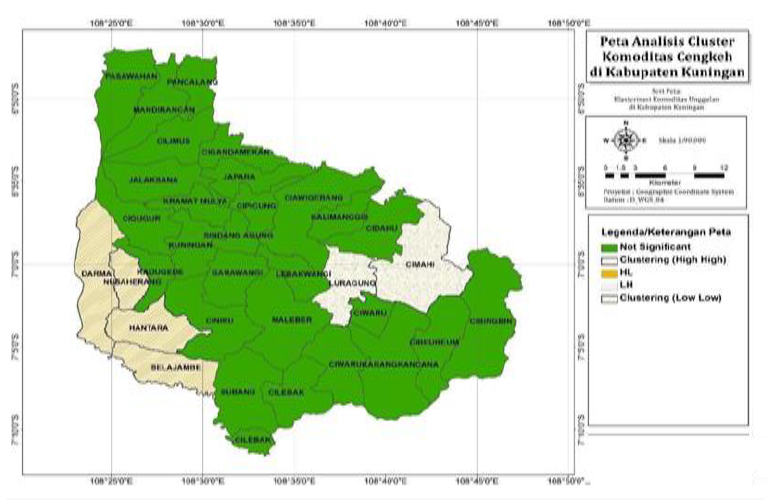
Based on the results of the cluster analysis (Figure 10), it was found that the areas included in the High High (HH) cluster consisted of 4 sub-districts. This indicates that the region is an area with high clove production and its surroundings (neighbors among the 4 sub-districts) also have high scores. These four districts are administratively located in the Kuningan Regency area in the western part. All sub-districts in the High High cluster are part of the Kuningan District. Geographically, clove commodities are ideally located in the highlands as are the characteristics of plantation crops in general. The western part of Kuningan Regency is included in the highlands, so clove production is relatively good. The regional regulation stipulates that the Kuningan District has superior commodity plantation crops, one of which is clove.
Figure 9: Results of the Spatial Autocorrelation Analysis of Clove Commodities
Figure 10: Clove Production Cluster Analysis Map
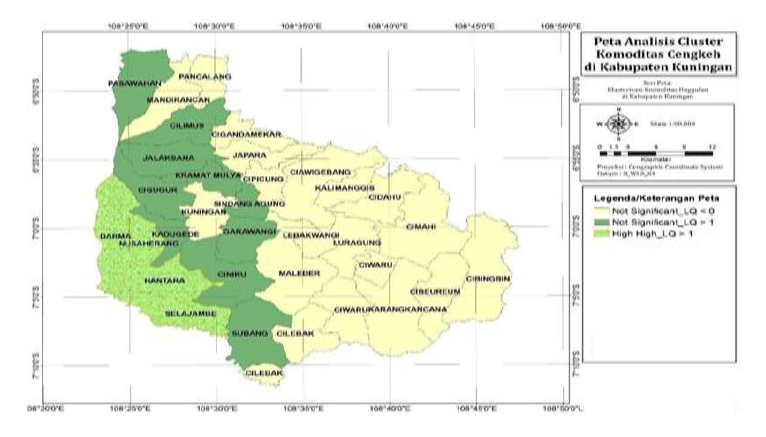
Figure 11 explains that the level of development of the clove commodity in Kuningan Regency is relatively concentrated in the west and north when viewed from the LQ value. Of the 32 sub-districts in Kuningan Regency, there are 14 sub-districts with an LQ value for cloves of more than 1, the majority of which are in the Kuningan and Cilimus Districts and only one is outside the Cilimus and Kuningan Districts (Subang District). The LQ value > explains that there is an indication of the concentration of clove production activities in the sub-region (sub-district), or it can also be interpreted that a sub-district area that has an LQ value > 1 has the potential to export clove production to other regions because its production is relatively above the average production in the entire coverage area of analysis. If equipped with the LI value, the LI value for cloves is 0.483, the value is close to 0.5, so it can be said that the development of a clove production activity will tend to develop in a centralized location. This means that the observed activity will develop better if it is carried out in certain locations. Even though clove LQ values > 1 were found in 14 sub-districts in Kuningan Regency, based on clustering analysis, only four sub-districts were statistically included in clusters with high clove production. Thus the High High cluster in Kuningan District can be the main driver of clove production in Kuningan District, while other areas serve as a buffer due to the focus on prodution for other commodity activities.
Figure 11: Map of Clove Clusters and LQ Values for each District
Figure 12: Results of Spatial Autocorrelation Analysis of Sugar Palm Commodities
Aren Commodity Analysis
Sugar palm is one of the potential plantation commodities, because of its coconut-like nature, every part of the palm tree can be utilized from the palm fiber, sap, leaves, and the palm tree trunk itself. Economically, palm trees can provide considerable benefits if managed properly, but most of the palms developed in Kuningan Regency are still natural and have not been developed massively. To complement the plantation commodities in the analysis, another plantation commodity was chosen, namely sugar palm to describe the potential distribution of its production in Kuningan Regency. Agropolitan area development seeks to identify certain commodities that have the potential to become superior commodities. With the characteristics of mountainous areas and the vast potential of agricultural land, it can be tried to get a picture of the clustering of sugar palm commodity production.
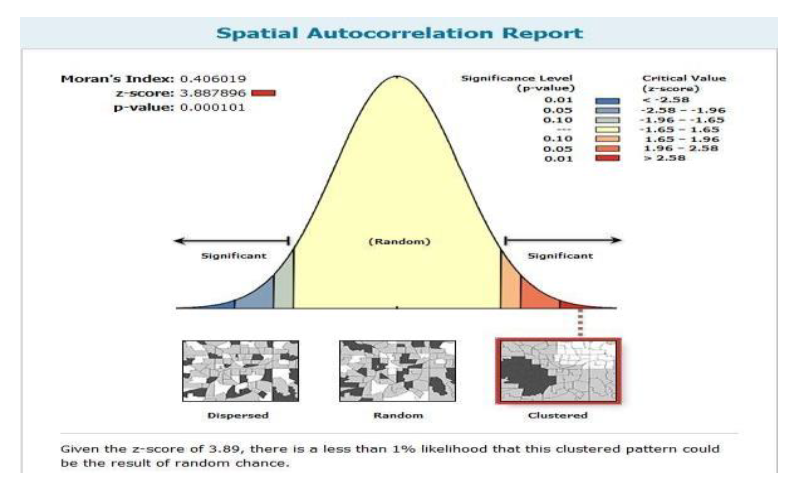
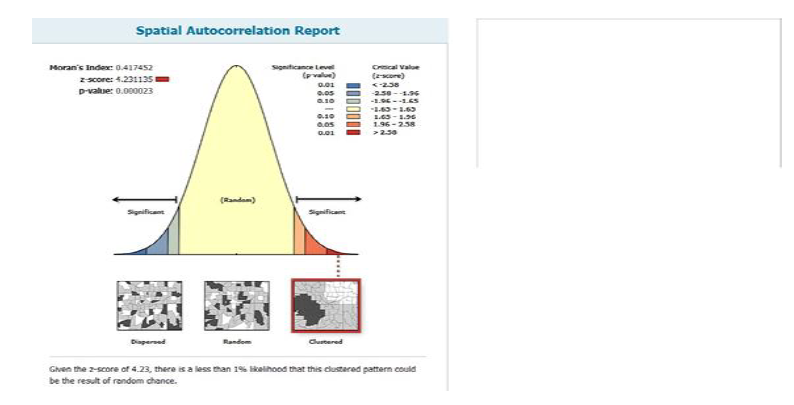
From the results of statistical calculations for the spatial autocorrelation of the sugar palm commodity, it can be seen that the sugar palm commodity has a fairly good clustering tendency with an error rate of 1%. Moran's index value (0.417) although in the middle between zero and one, indicates a strong and statistically significant clustering pattern (Table 4).
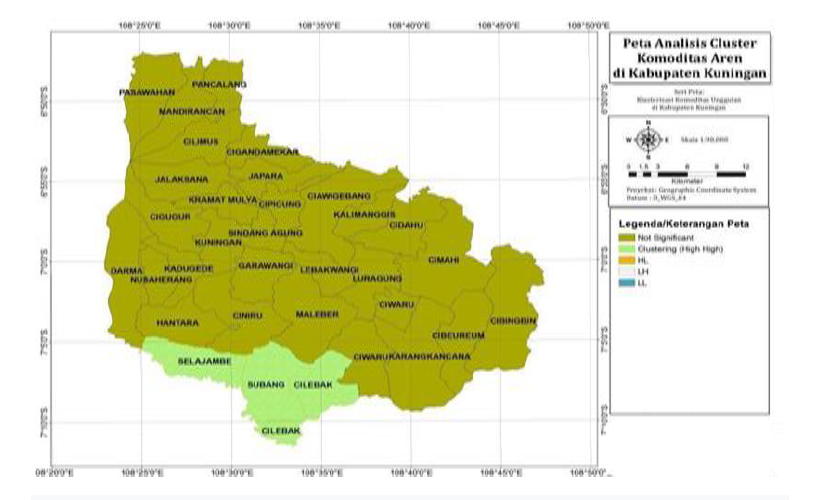
Based on the results of the cluster analysis (Figure 13), it was found that the areas included in the High High (HH) cluster consisted of 3 sub-districts. These three sub-districts are administratively located in the Kuningan Regency area in the south. The districts in the High High cluster are part of the Kuningan District and Luragung District. The regional regulation stipulates that aren is one of the leading commodities in Luragung District, while in Kuningan District, aren is not a superior commodity.
Table 3: Assessment of Spatial Clustering Using Moran’s I Measure
Moran's Index:
0.406019
Expected Index:
-0.032258
Variance:
0.012708
z-score:
3.887896
p-value:
0.000101
Table 4: Spatial Autocorrelation Analysis Using Moran’s I Statistic
Moran's Index:
0.417452
Expected Index:
-0.032258
Variance:
0.011297
z-score:
4.231135
p-value:
0.000023
Figure 13: Analysis Map of Aren Production Clusters
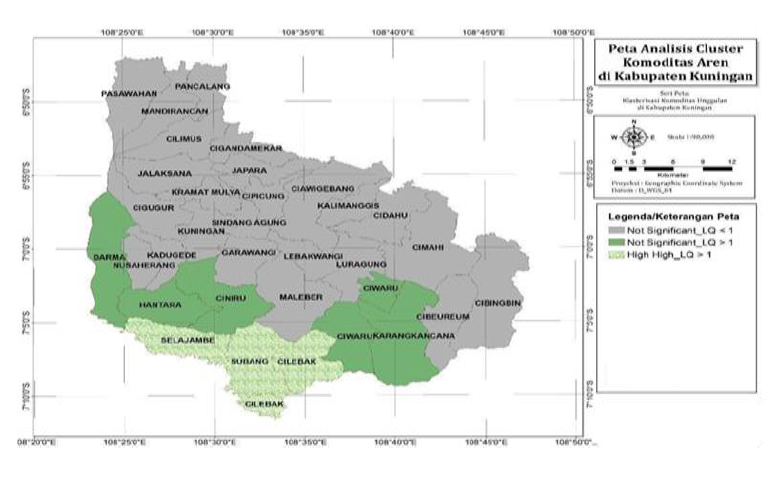
Figure 14 explains that the level of development of the sugar palm commodity in Kuningan Regency is relatively concentrated in the southern part and partly in the western region when viewed from the LQ value. Of the 32 sub-districts in Kuningan Regency, there are 8 sub-districts whose LQ value for aren is more than 1, the majority of which are in the Luragung District. The LQ value > explains that there is an indication of the concentration of sugar palm production activities in the sub-region (sub-district), or it can also be interpreted that a sub-district area that has an LQ value > 1 has the potential to export sugar palm production to other regions because its production is relatively above the average production in the entire coverage area of analysis. If equipped with the LI value, the LI value for aren is 0.785, the value is close to 1, it can be said that the development of palm sugar production activities tends to develop in a centralized location. This means that these activities will develop better if carried out in certain locations. Even though the LQ value of aren palms > 1 is found in 8 sub-districts in Kuningan Regency, based on clustering analysis, only three sub-districts are statistically included in the clusters with high aren production. Thus the sugar palm production cluster (High High) in Luragung District can be the main driver of aren production in Kuningan District, while other areas with LQ > 1 (in Kuningan District) function only as a buffer, because the analysis results are more suitable for other commodity activities (rice and cloves).
Figure 14: Map of Clove Clusters and LQ Values for each District
CONCLUSION
The distribution pattern of rice commodities is found in 4 sub-districts, namely Pasawahan, Cigugur, Kadugede and Nusaherang. The pattern of distribution of sweet potato commodities is found in 3 sub-districts, namely: Cilimus, Jalaksana and Cigandamekar. The distribution pattern of clove commodities is found in 4 sub-districts, namely: Darma, Nusaherang, Hantara and Selajambe. While the pattern of distribution of sugar palm commodities is found in 3 sub-districts, namely Cilebak, Selajambe and Subang
There are 4 agropolitan districts in Kuningan Regency, namely Kuningan District for rice and cloves, Luragung District for sugar palm, Cilimus District for sweet potato and Ciawigebang District
Recommendations
It needs to be equipped with indicators that can better show the spatial relationship between districts in Kuningan Regency from several other aspects (for example data on the distribution of commodities between regions)
Further analysis regarding support networks for the development of agropolitan districts needs to be mapped
REFERENCE
Bahasoan H. “Potensi pengembangan kawasan agropolitan di Kabupaten Serang dengan menggunakan model weighted overlay: potential development of agropolitan area in Serang regency using weighted overlay model.” Uniqbu Journal of Exact Sciences, vol. 2, no. 2, 2021, pp. 1–9. https://doi.org/10.47323/ujes.v2i2.
Annisa C.I. and E.B. Santoso. “Arahan pengembangan kawasan agropolitan berdasarkan komoditas unggulan prioritas tanaman pangan Kabupaten Bojonegoro.” Jurnal Teknik ITS, vol. 8, no. 2, 2020, pp. C175–C181.
Simanjuntak D. and Sirojuzilan. “Potensi wilayah dalam pengembangan kawasan agropolitan di Kabupaten Toba Samosir.” Jurnal Ekonomi dan Keuangan, vol. 1, no. 3, 2013, pp. 143–150.
Tarigan R. Ekonomi regional: teori dan aplikasi. Jakarta, Bumi Aksara, 2012.
Anselin L. and S.J. Rey. “Perspectives on spatial data analysis.” Springer Berlin Heidelberg, 2010, pp. 1–20.
Hendayana R. “Aplikasi metode location quotient (LQ) dalam penentuan komoditas unggulan nasional.” Informatika Pertanian, vol. 12, no. 1, 2003, pp. 658–675.
Rustiadi E. et al. “Perencanaan dan pembangunan wilayah.” Jakarta, Crestpent Press, 2011.
Payung G. et al. “Penentuan pusat pertumbuhan dan wilayah pengaruhnya berbasis Z-score analysis and gravity index (studi kasus: Provinsi Maluku).” Prosiding Temu Ilmiah IPLBI, 2016.
Hidayat A. et al. “Analisis pengembangan kawasan agropolitan di Kecamatan Sinjai Barat.” JAGAT (Jurnal Geografi Aplikasi dan Teknologi), vol. 5, no. 1, 2021, pp. 73–86. http://dx.doi.org/10.33772/jagat.v5i1.17856.
License
Creative Commons Attribution-NonCommercial-NoDerivatives 4.0 International License
All papers should be submitted electronically. All submitted manuscripts must be original work that is not under submission at another journal or under consideration for publication in another form, such as a monograph or chapter of a book. Authors of submitted papers are obligated not to submit their paper for publication elsewhere until an editorial decision is rendered on their submission. Further, authors of accepted papers are prohibited from publishing the results in other publications that appear before the paper is published in the Journal unless they receive approval for doing so from the Editor-In-Chief.
Himalayan Journal of Economics and Business Management open access articles are licensed under a Creative Commons Attribution-Share A like 4.0 International License. This license lets the audience to give appropriate credit, provide a link to the license, and indicate if changes were made and if they remix, transform, or build upon the material, they must distribute contributions under the same license as the original.
Advertisement
Recommended Articles
Research Article
The impact of organizational flexibility on improving institutional performance in Iraqi business organizations
Muntaha Abdul Hassan Salih
Published: 22/01/2026
Download PDF
Cite
x
APA
Salih, M. A. H. (2026). The impact of organizational flexibility on improving institutional performance in Iraqi business organizations. Himalayan Journal of Economics and Business Management, 7(1), 1-9.
MLA
Salih, Muntaha A. H.. "The impact of organizational flexibility on improving institutional performance in Iraqi business organizations." Himalayan Journal of Economics and Business Management 7.1 (2026): 1-9.
Chicago
Salih, Muntaha A. H.. "The impact of organizational flexibility on improving institutional performance in Iraqi business organizations." Himalayan Journal of Economics and Business Management 7, no. 1 (2026): 1-9.
Harvard
Salih, M. A. H. (2026) 'The impact of organizational flexibility on improving institutional performance in Iraqi business organizations' Himalayan Journal of Economics and Business Management 7(1), pp. 1-9.
Vancouver
Salih MAH. The impact of organizational flexibility on improving institutional performance in Iraqi business organizations. Himalayan Journal of Economics and Business Management. 2026 Jan;7(1):1-9.
Download PDF
Research Article
Influence of Leadership on Poverty Reduction in the Devolved Government in Trans-Nzoia County, Kenya
Kinisu Sifuna,
...
Peter Simotwo
Published: 30/06/2021
Download PDF
Cite
x
APA
Sifuna, K., Lwangale, D. W., Simotwo, P., Sifuna, K., Lwangale, D. W. & Simotwo, P. (2021). Influence of Leadership on Poverty Reduction in the Devolved Government in Trans-Nzoia County, Kenya. Himalayan Journal of Economics and Business Management, 2(1), None-None.
MLA
Sifuna, Kinisu, et al. "Influence of Leadership on Poverty Reduction in the Devolved Government in Trans-Nzoia County, Kenya." Himalayan Journal of Economics and Business Management 2.1 (2021): None-None.
Chicago
Sifuna, Kinisu, David W. Lwangale, Peter Simotwo, Kinisu Sifuna, David W. Lwangale and Peter Simotwo. "Influence of Leadership on Poverty Reduction in the Devolved Government in Trans-Nzoia County, Kenya." Himalayan Journal of Economics and Business Management 2, no. 1 (2021): None-None.
Harvard
Sifuna, K., Lwangale, D. W., Simotwo, P., Sifuna, K., Lwangale, D. W. and Simotwo, P. (2021) 'Influence of Leadership on Poverty Reduction in the Devolved Government in Trans-Nzoia County, Kenya' Himalayan Journal of Economics and Business Management 2(1), pp. None-None.
Vancouver
Sifuna K, Lwangale DW, Simotwo P, Sifuna K, Lwangale DW, Simotwo P. Influence of Leadership on Poverty Reduction in the Devolved Government in Trans-Nzoia County, Kenya. Himalayan Journal of Economics and Business Management. 2021 Jan;2(1):None-None.
Download PDF
Research Article
Modelling Structure Job Quality, Job Design and Job Satisfaction
Moch Nurhadi,
...
Avi Sunani
Published: 30/08/2022
Download PDF
Cite
x
APA
Nurhadi, M., Bisyri Effendi, M., Saiful Ulum, A. & Sunani, A. (2022). Modelling Structure Job Quality, Job Design and Job Satisfaction. Himalayan Journal of Economics and Business Management, 3(2), 1-4.
MLA
Nurhadi, Moch, et al. "Modelling Structure Job Quality, Job Design and Job Satisfaction." Himalayan Journal of Economics and Business Management 3.2 (2022): 1-4.
Chicago
Nurhadi, Moch, Moch Bisyri Effendi, Achmad Saiful Ulum and Avi Sunani. "Modelling Structure Job Quality, Job Design and Job Satisfaction." Himalayan Journal of Economics and Business Management 3, no. 2 (2022): 1-4.
Harvard
Nurhadi, M., Bisyri Effendi, M., Saiful Ulum, A. and Sunani, A. (2022) 'Modelling Structure Job Quality, Job Design and Job Satisfaction' Himalayan Journal of Economics and Business Management 3(2), pp. 1-4.
Vancouver
Nurhadi M, Bisyri Effendi M, Saiful Ulum A, Sunani A. Modelling Structure Job Quality, Job Design and Job Satisfaction. Himalayan Journal of Economics and Business Management. 2022 Jul;3(2):1-4.
Download PDF
Research Article
Accountability and Transparency of Village Fund Management in Lumajang District
Nurina Ayuningtiyas,
...
Muhammad Miqdad
Published: 28/12/2023
Download PDF
Cite
x
APA
Ayuningtiyas, N., Santosa Putra, H. & Miqdad, M. (2023). Accountability and Transparency of Village Fund Management in Lumajang District. Himalayan Journal of Economics and Business Management, 4(2), 1-4.
MLA
Ayuningtiyas, Nurina, Hendrawan Santosa Putra and Muhammad Miqdad. "Accountability and Transparency of Village Fund Management in Lumajang District." Himalayan Journal of Economics and Business Management 4.2 (2023): 1-4.
Chicago
Ayuningtiyas, Nurina, Hendrawan Santosa Putra and Muhammad Miqdad. "Accountability and Transparency of Village Fund Management in Lumajang District." Himalayan Journal of Economics and Business Management 4, no. 2 (2023): 1-4.
Harvard
Ayuningtiyas, N., Santosa Putra, H. and Miqdad, M. (2023) 'Accountability and Transparency of Village Fund Management in Lumajang District' Himalayan Journal of Economics and Business Management 4(2), pp. 1-4.
Vancouver
Ayuningtiyas N, Santosa Putra H, Miqdad M. Accountability and Transparency of Village Fund Management in Lumajang District. Himalayan Journal of Economics and Business Management. 2023 Jul;4(2):1-4.
Bahasoan, H., Pramudita, D. & Nurwiana, I. (2023). Application of Agropolitan for Regional Agricultural Commodities Using Spatial Autocorrelattion in Kuningan Regency West Java Indonesia. Himalayan Journal of Economics and Business Management, 4(1), 1-8.
MLA
Bahasoan, Husen, Danang Pramudita and Ida Nurwiana. "Application of Agropolitan for Regional Agricultural Commodities Using Spatial Autocorrelattion in Kuningan Regency West Java Indonesia." Himalayan Journal of Economics and Business Management 4.1 (2023): 1-8.
Chicago
Bahasoan, Husen, Danang Pramudita and Ida Nurwiana. "Application of Agropolitan for Regional Agricultural Commodities Using Spatial Autocorrelattion in Kuningan Regency West Java Indonesia." Himalayan Journal of Economics and Business Management 4, no. 1 (2023): 1-8.
Harvard
Bahasoan, H., Pramudita, D. and Nurwiana, I. (2023) 'Application of Agropolitan for Regional Agricultural Commodities Using Spatial Autocorrelattion in Kuningan Regency West Java Indonesia' Himalayan Journal of Economics and Business Management 4(1), pp. 1-8.
Vancouver
Bahasoan H, Pramudita D, Nurwiana I. Application of Agropolitan for Regional Agricultural Commodities Using Spatial Autocorrelattion in Kuningan Regency West Java Indonesia. Himalayan Journal of Economics and Business Management. 2023 Jan;4(1):1-8.