Hepatitis B transmission takes place via body fluids causing higher mortality rates around the world. Various biochemicals serve as predicting factors for CHB. This study is a cross-sectional study performed over the Uttar Pradesh population to predict various prognostic markers in assessing the effectiveness of various serum levels and liver disparity among CHB infected population of the state. Various biochemical factors were studied with respect to liver adversity by analysing biochemical reports and viral load quantity of CHB patients at the Department of Medicine OPD, KGMU, Lucknow. It was concluded that ALT, AST, creatinine, INR, bilirubin serum levels, and various score (ALBI, APRI) play an important role in diagnosing liver fibrosis and the liver adversity. This study states that there is no correlation between ALT/ AST and HBV DNA levels study would help in predicting the role of serum levels via monitoring of the elevated and demoted levels of biomarkers present in body fluids.
Keywords
CHB
APRI Score
ALBI Score
ALT
AST
HBV DNA
Hbeag
Hbeab
INTRODUCTION
Hepatitis B is a common transmissible disease-causing morbidity and mortality in the world (Mcmahon, n.d.). Its transmission takes place via body fluids such as saliva, blood, sweat, vaginal fluids, etc. These body fluids consist of various enzymes such as Alanine aminotransferase (ALT), Aspartate transaminase (AST), Alkaline Phosphatase (ALP), has significant relatedness in the prognosis of hepatic diseases such as CHB (Chronic Hepatitis-B), cirrhosis, HCC (Hepatocellular Carcinoma) [1]. It has been studied that these biochemical parameters such as ALT show variation with age, gender, body mass index, time of day, and abnormalities in lipid and carbohydrate metabolism [2]. Elevated and demoted levels of these enzymes result in dysfunction in the liver and liver-related diseases. Association of Cirrhosis and liver-related mortality to ALT levels in liver diseases within different sex are set by American Association for the Study of Liver Diseases (AASLD) at 30 IU/L for men and 19 IU/L for women rather than its classical range of 40 U/L to 70 U/L [3]. As per international guidelines, elevated ALT rates more than the normal upper limit can be used as markers/ key indicators for treating CHB patients with antiviral drugs [4]. HBV DNA quantification measures viral replication and its high levels predict the prognosis of cirrhosis, HCC, and other liver disease [5]. Cheap and simple methods such as ALBI Score and APRI score were used for liver fibrosis evaluation to predict prognosis in patients suffering from liver cirrhosis with or without HCC [6]. The current study has been done on HBsAg-positive patients to diagnose the effect of histopathological serums and HBV DNA levels based on the HBeAg and HBeAb status of CHB patients and liver adversity development. This study would depict about prognosis and development of CHB which also leads to various liver adversity in the population of Uttar Pradesh Province, India.
MATERIALS AND METHODS
This is a cross-sectional, baseline study performed over 150 patients, among which firstly 142 patients were selected for the study rest were excluded as they lack complete and significant data. Later on, three more index patients were excluded from the study due to co-morbidities HCV (2) and HIV (1) few inclusive criteria but later on due to incomplete and insignificant data three more patients were excluded from the study. So, in the end only 139 patients were included in further study. Patients were selected from all zones of Uttar Pradesh province, who visited Hepatobiliary medicine OPD at KGMU. All patients agreed to submit their concerns for sharing their details via questionnaire.
Ethics
Ethical approval has been taken from Institute Ethics Committee (IEC) of King George’s Medical University (KGMU), Lucknow, India.
Selection of Study Participants
Inclusion and exclusion criteria for subjects in the study- Subjects showing hepatitis-B virus reactivity and of age less than 70 and diabetes, and hypertension were included in the study. Subjects with age more than 70 and have co-morbidities such as HCV, and HIV were excluded from this study.
Study Setup and Clinical Data Collection
The study setup was conducted at the Department of Medicine OPD of KGMU. Data was collected by filling up of questionnaire (proforma) enlisting all required details for the study to be performed. Patients’ reports were assessed for filling up as well as evaluation of data.
Data Analysis
Data were analysed on the basis of Albumin and bilirubin (ALBI Score), liver enzyme and platelet count (APRI Score), adopted widely for assessing and prognosis of liver dysfunction and liver diseases (CHB, cirrhosis, HCC, and so forth). Statistically, data were analysed for the comparative study of different biochemical parameters, correlation among all the factors associated with the progression of HBV, and regression analysis to assess a relationship between various factors.
ALBI score determines the fibrositis of liver. Stages of fibrosis were defined as follows: stage 1, portal or central fibrosis; stage 2 some septa; stage 3, many septa; and stage 4, cirrhosis [6]. APRI score is also significant in diagnosing liver fibrosis.
All the results were expressed as mean standard deviation or frequency (in percent). Normally distributed quantitative and categorical variables were compared using the student's t-test and chi-square test, respectively. Non-parametric unpaired data were compared using Mann–Whitney U-test. All the analyses were performed using SPSS 20v software. A p-value of<0.05 was considered statistically significant.
RESULTS
Out of the total enrolled 150 patients only 139 were selected as sample population in this study. 139 subjects enclosed of 96 males and 43 females. The average age of the whole population was 36.89 (SD±13.703) while that of males and females separately was 37.64 (SD±14.50) and 35.20 (SD±11.70). The recorded minimum age of Male and female index patients was 17 and 14 years of age and a maximum of 88 and 62 years, respectively were enrolled in this study.
A descriptive analysis of viral load, liver function enzymes, kidney function enzymes, and all other recorded biochemical factors were analysed (mean and standard deviation) to calculate the equal distribution of values within the recorded data, to provide information about the data (refer to Table 1). It has been found that 52.08% of total enrolled male patients had elevated ALT serum levels and females reported 32.55%. Irrespective of ALT, AST levels in males and females were 50% and 30.23%, a reduced rate than ALT. Mann Whitney U test was performed to calculate no significant difference between AST/ALT scores with respect to the gender of patients enrolled in the study. An insignificant value of 0.194 was calculated for a 0.05 p-value, as the obtained value was greater than the p-value, hence we accept the hypothesis. Females had a higher mean rank (76.63) than those males (67.03) in the study performed.
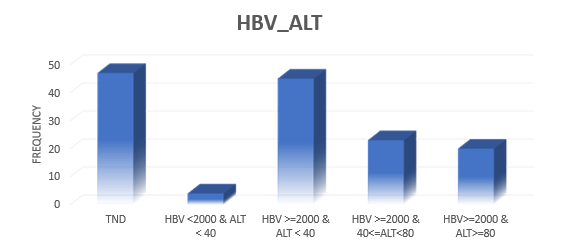
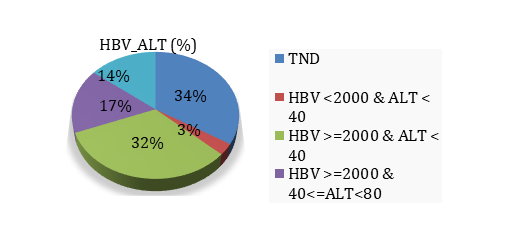
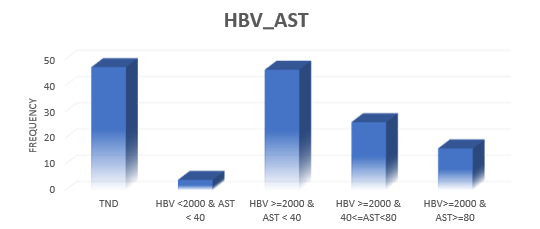
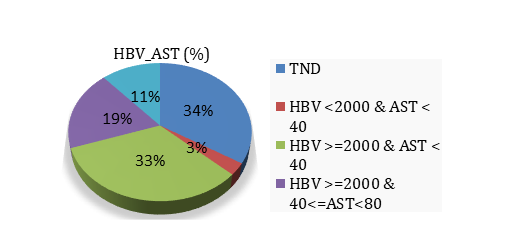
For further analysis, index patients have been categorized into 5 groups on the basis of viral test not detected, viral load and AST/ ALT liver enzyme with varied levels. This would determine an association between viral load and liver enzymes with other biochemical factors for HBsAg positivity among patients.
Table 1: Represents the Mean and Standard Deviation of Biochemical Factors Associated With Hepatitis-B Prognosis and Development
Biochemical Factors
Mean
Std. Deviation
HBV DNA
780840253.24
8312358918.52
ALT
105.78
239.96
AST
94.77
234.07
Hb
12.93
3.20
TLC
8692.91
7606.75
Creatinine
0.92
0.26
Bilirubin
0.97
0.89
Albumin
4.19
0.65
INR
1.18
0.62
Protein
7.29
1.11
Platelet
171262.59
82927.70
APRI Score
0.003585
0.02
ALBI Score
-0.65
0.31
Figure 1: Representing the Frequency of Patients Fallen under 5 Distinct Categories- (i) TND (test not detected) (47), (ii) HBV<2000 and ALT<40 (4), (iii) HBV> = 2000 and ALT<40 (45), (iv) HBV> = 2000 and 40< = ALT<80 (23), (v) HBV> = 2000 and ALT> = 80 (20)
Table 2: Representation of Mean and Standard Deviation of Various Biochemical Factors With Respect To Varied Viral Load (HBV DNA) and ALT Serum Level Present In the Body of CHB Patients
HBV DNA_ALT
AST
Hb
TLC
Creatinine
Bilirubin
Albumin
INR
Protein
Platelet
HBV DNA TND
Mean
146.53
12.98
9103.94
0.89
1.03
4.29
1.14
7.43
170893.62
S.D.
376.83
2.11
7739.43
0.26
0.71
0.63
0.29
1.005
77366.21
HBV<2000 and ALT<40
Mean
24.35
13.95
8600.00
1.03
0.52
3.85
1.02
7.002
245250.00
S.D.
9.27
1.61
2688.246
0.19
0.22
0.81
0.05
0.64
120014.93
HBV> = 2000 and ALT<40
Mean
39.85
12.72
9016.20
0.87
0.71
4.12
1.12
7.03
174300.00
S.D.
51.35
4.55
10542.06
0.27
0.45
0.59
0.33
1.32
88797.54
HBV> = 2000 and 40< = ALT<80
Mean
50.67
13.42
7773.91
0.97
1.14
4.40
1.44
7.45
172913.04
S.D.
33.75
2.24
2216.71
0.25
1.15
0.74
1.39
1.14
69348.20
HBV> = 2000 and ALT> = 80
Mean
161.51
12.50
8075.00
0.99
1.33
3.97
1.17
7.45
148600.00
S.D.
157.66
2.92
2993.30
0.26
1.47
0.63
0.12
0.79
87385.05
Table 3: Representation of Mean and Standard Deviation of Various Biochemical Factors With Respect To Varied Viral Load (HBV DNA) and AST Serum Level Present In the Body of CHB Patients
HBV DNA_AST
ALT
Hb
TLC
Creatinine
Bilirubin
Albumin
INR
Protein
Platelet
HBV DNA TND
Mean
136.50
12.987
9103.94
0.89
1.03
4.29
1.14
7.43
170893.62
S.D.
314.06
2.1107
7739.43
0.26
0.72
0.63
0.29
1.00
77366.21
HBV<2000 and AST<40
Mean
16.99
13.95
8600.00
1.03
0.52
3.85
1.02
7.00
245250.00
S.D.
6.21
1.61
2688.25
0.19
0.22
0.81
0.05
0.64
120014.93
HBV> = 2000 and AST<40
Mean
32.32
13.73
9474.54
0.86
0.65
4.33
1.03
7.24
196163.04
S.D.
16.82
3.96
10306.55
0.24
0.40
0.46
.10
1.27
83499.70
HBV> = 2000 and 40< = AST<80
Mean
66.24
11.665
7146.15
.95
1.13
4.09
1.54
6.93
145000
S.D.
53.68
3.40
2698.47
.22
1.07
0.81
1.33
1.18
64431.05
HBV> = 2000 and AST> = 80
Mean
40.56
12.27
7775.00
1.06
1.60
3.76
1.20
7.69
124937.50
S.D.
18.55
2.88
2989.87
.35
1.58
0.68
0.14
0.69
85734.06
Figure 2: Representing the Percentage of Patients Fallen Under 5 Distinct Categories- (I) TND (Test Not Detected) (34%), (Ii) HBV<2000 And ALT<40 (3%), (Iii) HBV> = 2000 And ALT<40 (32%), (IV) HBV> = 2000 And 40< = ALT<80 (17%), (V) HBV> = 2000 And ALT> = 80 (14%)
Figure 3: Representing the Frequency of Patients Fallen under 5 Distinct Categories- (I) TND (Test Not Detected) (47), (Ii) HBV<2000 And AST<40 (4), (Iii) HBV> = 2000 And AST<40 (46), (Iv) HBV> = 2000 And40< = AST<80 (26), (V) HBV> = 2000 And AST> = 80 (16)
Figure 4: Representing the Percentage of Patients Fallen under 5 Distinct Categories- 1. TND (Test Not Detected) (34%), HBV<2000 and AST<40 (3%), HBV> = 2000 and AST <40 (33%), HBV> = 2000 and 40< = AST<80 (19%), HBV> = 2000 and AST> = 80 (11%)
A frequency and percentage-wise distribution of HBV DNA and ALT (Graphs 1 and 2) and HBV DNA and AST (Graphs 3 and 4) of the infected population have been represented graphically.
A comparative study of HBV DNA (viral load) and ALT and HBV DNA and AST mean values were performed to determine any effect or association between ALT and AST levels and other biochemical factors. The findings of the study reveal that there is no significant difference between the biochemical data i.e., liver enzymes and kidney biomarkers of patients of Category 1 with no viral load detected (TND).
In Category 2, ALT level is less than AST, there is no difference in haemoglobin level, and total leucocyte count (TLC) is low level in AST. Creatinine level was 0.51 value more in HBV DNA and ALT than HBV DNA and AST. Albumin, INR, protein had undifferentiated values in both HBV DNA and ALT than HBV DNA and AST.
Category 3, a difference of 1.01 in haemoglobin level, value of TLC was higher in HBV DNA and ALT by 458 than HBV DNA and AST, creatinine showed 0.01greater difference high in, higher albumin, 0.21, in HBV DNA and AST than ALT, INR level showed 0.09 elevation in HBV DNA and ALT, 21863 platelets higher in HBV DNA and AST, HBV DNA and AST has higher protein level 0.21than HBV DNA and ALT.
In category 4, 1.76 more haemoglobin of HBV DNA and ALT than HBV DNA and AST, higher TLC of 627.86, creatinine of 0.02, albumin of 0.31 and 0.01 bilirubin in subjects of HBV DNA and ALT than in group HBV DNA and AST, whereas 0.14 protein and 0.1 INR levels were higher in HBV DNA and AST than HBV DNA and ALT.
Category 5, includes higher level of difference of haemoglobin (0.23), TLC (300), albumin (0.21), platelets (23763) than HBV DNA and ALT than HBV DNA and AST. Whereas HBV DNA and AST shows a higher level of difference of creatinine (0.07), bilirubin (0.27), INR (0.03), protein (0.24) than HBV DNA and ALT.
ALBI score assesses liver disparity with varied grades, grade1 (ALBI score≤-2.6), grade2 (-2.59<ALBI score<-139), grade 3 (≥-1.39) [7]. An independent t-test was performed to evaluate the association between HBsAg-positive males and females to ALBI score reported based on their Albumin and Bilirubin levels. The mean ALBI score was -.659 (Sd±.3143). A statistically significant value of 0.115 was obtained for the ALBI score and patients’ gender.
APRI score determines the liver fibrosis in the prognosis of cirrhosis. An APRI score>1.5 is the cut-off for significant fibrosis, whereas a score<0.5 can rule it out. Mann-Whitney U test was performed to figure out an association between the APRI Score and the gender of reported patients. Males ranked higher with a greater APRI score of 59.95 whereas females ranked 74.50 with a significant value of 0.049 which is less than the statistically significant p-value of 0.05. The mean range of the APRI score was .003585 (SD±0226980).
Pearson Correlation between APRI Score and Age of the HBsAg positive patients has been studied and a 0.56 significant value was calculated which is greater than 0.05 therefore we accept the hypothesis and conclude that there is no correlation studied between the age of HB positive patients and liver fibrosis. ALBI Score and age have no correlation as an insignificant 0.679 value was obtained.
DISCUSSION
In this study, all patients have been studied on the basis of varied HBV DNA levels, serum ALT, and AST, either raised or demoted along with ALBI score, and APRI score. During the entire course of CHB, HBV replication occurs and variation in serum levels is studied too. HBV DNA is a major risk factor for cirrhosis and HCC [8]. The measurement of serum ALT continues to be the most accessible way to monitor the progression of chronic hepatitis B as per a study by Tsang et al. [5].
In this study it has been found that, under different categories either of HBV DNA and ALT or HBV DNA and AST and other biochemical factors in CHB patients gave varied result. For instance, patients falling under category1 (HBV DNA TND) had shown no difference in any of biochemical parameters either of ALT based viral load group or AST based viral load group. In category 2 (HBV<2000 and ALT<40), high haemoglobin (Hb) and TLC reported in ALT based viral load, and high creatinine in AST based viral load, whereas there was no difference in albumin, INR, platelet, protein in both groups. In category 3,4 and 5, Hb, TLC, and creatinine reported with elevated levels, whereas only in category bilirubin was high but in category 4 and 5 bilirubin and INR were elevated in HBV DNA and ALT group and viral load AST group reported vice-versa elevation and demotion in biochemical levels. It was reported in this that there is no correlation between ALT /AST serum levels to HBV DNA with correlation significance of 0.88 for ALT and 0.93 for AST serum level which is dissimilar to the previous study by Esmaeelzadeh A et al, [9] which stated there is correlation between HBV DNA levels and ALT serum levels rather than AST serum levels. HBV DNA is still an important prognostic marker in CHB and mildly elevated ALT levels play an important role in histologic disease. So, ALT has a wider approach in CHB diagnosis, as it varies with HBV DNA levels and biochemical serum levels, and prognostic than AST along with the viral load of CHB patients
ALBI score is a measurement scale for assessment of HBV related Acute on chronic liver failure (ACLF), HBV- related liver cirrhosis, HBV related hepatocellular carcinoma (HCC) with grades and it has a moderate diagnostic ability of liver fibrosis superior to APRI index [10,6]. Calculated mean ALBI score was -.659468 (Sd±0.3142788) and it was reported that no patients had grade 3 ALBI score≤-2.6), 1 patient under grade2 (-2.59<ALBI score<-139), 138 subjects of grade3 (≥-1.39), it was different from other previous studies, in which patients were reported under grade 3, in grade 2 and in grade 1 of ALBI score Lei et al. [10] which had reported ACLF, LC and HCC patients. An independent t-test was performed for HBsAg Positive patients with varied ALBI Score, resulting in a statistically insignificant value is 0.115 which is>.05 and the t-statistic value is 1.597 hence we do not reject Ho and conclude that there is no significant difference in the ALBI Score with respect to the patient’s gender. ALBI Score and age have no correlation as an insignificant 0.679 value was obtained. Therefore, we accept the hypothesis that there is no correlation between age and ALBI score in the prognosis of liver diseases (ACLF, LC, HCC).
In the present study, the APRI score was studied over the population enrolled to assess the prognosis of liver fibrosis stage 4 and in predicting the development of cirrhosis in patients enrolled [11]. An insignificant Mann-Whitney U test was calculated which rejected the hypothesis and conclude that the APRI score depends on the gender of patients enrolled female with a specific 59.95 rank and a male with a 74.50 rank significance were reported. It denotes that males have a higher APRI score rank than females. No patient was scored above<0.5 therefore it can be deduced that enrolled patients have good level of fibres in their liver. A statistically insignificant Pearson correlation was obtained for at 0.56 greater than the p-value of 0.05. Hence, it can be concluded that there is no correlation between age and prognosis of liver fibrosis.
This study has certain limitations such as it does not provide information concerning the protective effect of antibodies in patients with liver failure or the effect of progression of liver disease on antibodies. As HBV DNA acts as an important prognostic marker therefore monitoring of seroprevalence rate and follow-up study should be done for evaluating liver conditions.
The future frame of reference- This study defines the role of biochemical factors in treatment of CHB patients. Therefore, a monitored study of biochemicals must be performed so that only by assessing the pattern of these biomarkers, severity of CHB can be easily predicted.
REFERENCE
Chen, R.C. et al. "Usefulness of Albumin-Bilirubin Grade for Evaluation of Long-Term Prognosis for Hepatitis B-Related Cirrhosis." Journal of Viral Hepatitis, vol. 24, no. 3, 2017, pp. 238–245. https://doi.org/10.1111/jvh.12638.
Chao, D.T. et al. "Systematic Review with Meta-Analysis: The Proportion of Chronic Hepatitis B Patients with Normal Alanine Transaminase≤40 IU/L and Significant Hepatic Fibrosis." Alimentary Pharmacology and Therapeutics, vol. 39, no. 4, 2014, pp. 349–358. https://doi. org/10.1111/apt.12590.
Park, J.H. et al. "Low Alanine Aminotransferase Cut-Off for Predicting Liver Outcomes: A Nationwide Population-Based Longitudinal Cohort Study." Journal of Clinical Medicine, vol. 8, no. 9, 2019. https://doi.org/10.3390/jcm8 091445.
Wong, G.L.H. et al. "Normal On-Treatment ALT during Antiviral Treatment Is Associated with a Lower Risk of Hepatic Events in Patients with Chronic Hepatitis B." Journal of Hepatology, vol. 69, no. 4, 2018, pp. 793–802. https://doi.org/10.1016/j.jhep.2018.05.009.
Tsang, P.S.Y. et al. "Significant Prevalence of Histologic Disease in Patients with Chronic Hepatitis B and Mildly Elevated Serum Alanine Aminotransferase Levels." Clinical Gastroenterology and Hepatology, vol. 6, no. 5, 2008, pp. 569–574. https://doi.org/10.1016/j.cgh.2008.02.037.
Fujita, K. et al. "Albumin-Bilirubin Score Differentiates Liver Fibrosis Stage and Hepatocellular Carcinoma Incidence in Chronic Hepatitis B Virus Infection: A Retrospective Cohort Study." American Journal of Tropical Medicine and Hygiene, vol. 101, no. 1, 2019, pp. 220–225. https://doi.org/10.4269/ajtmh.19-0129.
Deng, M. et al. "Clinical Application of Albumin-Bilirubin (ALBI) Score: The Current Status." The Surgeon, vol. 18, no. 3, 2020, pp. 178–186. Elsevier Ltd. https://doi.org/10.101 6/j.surge.2019.09.002.
Diktas, H. et al. "Comparison of Relationship between Histopathological, Serological and Biochemical Parameters in Patients with Chronic Hepatitis B Infection." Postgraduate Medical Journal, vol. 92, no. 1094, 2016, pp. 693–696. https://doi.org/10.1136/postgradmedj-2016-1 3 4069.
Esmaeelzadeh, A. et al. "Evaluation of Serum HBV Viral Load, Transaminases and Histological Features in Chronic HBeAg-Negative Hepatitis B Patients." Gastroenterology and Hepatology from Bed to Bench, vol. 10, no. 1, 2017, pp. 39–43.
Lei, Q. et al. "Value of the Albumin-Bilirubin Score in the Evaluation of Hepatitis B Virus-Related Acute-on-Chronic Liver Failure, Liver Cirrhosis, and Hepatocellular Carcinoma." Experimental and Therapeutic Medicine, vol. 15, no. 3, 2018, pp. 3074–3079. https://doi.org/10.3892/ etm.2018.5748.
Parikh, P. et al. Tsochatzis. "Fibrosis Assessment in Patients with Chronic Hepatitis B Virus (HBV) Infection." Annals of Translational Medicine, vol. 5, no. 3, 2017. https://doi.org/10.21037/atm.2017.01.28.
McMahon, B. J. "Epidemiology and Natural History of Hepatitis B." n.d.
License
Creative Commons Attribution-NonCommercial-NoDerivatives 4.0 International License
All papers should be submitted electronically. All submitted manuscripts must be original work that is not under submission at another journal or under consideration for publication in another form, such as a monograph or chapter of a book. Authors of submitted papers are obligated not to submit their paper for publication elsewhere until an editorial decision is rendered on their submission. Further, authors of accepted papers are prohibited from publishing the results in other publications that appear before the paper is published in the Journal unless they receive approval for doing so from the Editor-In-Chief.
Himalayan Journal of Community Medicine and Public Health open access articles are licensed under a Creative Commons Attribution-Share A like 4.0 International License. This license lets the audience to give appropriate credit, provide a link to the license, and indicate if changes were made and if they remix, transform, or build upon the material, they must distribute contributions under the same license as the original.
Recommended Articles
Research Article
Assessing the Role of Community Engagement in Promoting Malaria Prevention and Treatment Practices in Mashonaland Central Province, Zimbabwe: A Case of Centenary District
Dzamara Tafadzwa,
Mapuranga Danemore
Published: 13/08/2026
Download PDF
Cite
x
APA
Tafadzwa, D. & Danemore, M. (2026). Assessing the Role of Community Engagement in Promoting Malaria Prevention and Treatment Practices in Mashonaland Central Province, Zimbabwe: A Case of Centenary District. Himalayan Journal of Community Medicine and Public Health, 7(1), 1-6.
MLA
Tafadzwa, Dzamara and Mapuranga Danemore. "Assessing the Role of Community Engagement in Promoting Malaria Prevention and Treatment Practices in Mashonaland Central Province, Zimbabwe: A Case of Centenary District." Himalayan Journal of Community Medicine and Public Health 7.1 (2026): 1-6.
Chicago
Tafadzwa, Dzamara and Mapuranga Danemore. "Assessing the Role of Community Engagement in Promoting Malaria Prevention and Treatment Practices in Mashonaland Central Province, Zimbabwe: A Case of Centenary District." Himalayan Journal of Community Medicine and Public Health 7, no. 1 (2026): 1-6.
Harvard
Tafadzwa, D. and Danemore, M. (2026) 'Assessing the Role of Community Engagement in Promoting Malaria Prevention and Treatment Practices in Mashonaland Central Province, Zimbabwe: A Case of Centenary District' Himalayan Journal of Community Medicine and Public Health 7(1), pp. 1-6.
Vancouver
Tafadzwa D, Danemore M. Assessing the Role of Community Engagement in Promoting Malaria Prevention and Treatment Practices in Mashonaland Central Province, Zimbabwe: A Case of Centenary District. Himalayan Journal of Community Medicine and Public Health. 2026 Jan;7(1):1-6.
Download PDF
Research Article
Curves of Concern: Public Awareness of Scoliosis and Its Impact on Childhood Development in Hamirpur
Vishal Dhatwalia,
Swati Chandel
Published: 10/12/2024
Download PDF
Cite
x
APA
Dhatwalia, V. & Chandel, S. (2024). Curves of Concern: Public Awareness of Scoliosis and Its Impact on Childhood Development in Hamirpur. Himalayan Journal of Community Medicine and Public Health, 5(2), 1-6.
MLA
Dhatwalia, Vishal and Swati Chandel. "Curves of Concern: Public Awareness of Scoliosis and Its Impact on Childhood Development in Hamirpur." Himalayan Journal of Community Medicine and Public Health 5.2 (2024): 1-6.
Chicago
Dhatwalia, Vishal and Swati Chandel. "Curves of Concern: Public Awareness of Scoliosis and Its Impact on Childhood Development in Hamirpur." Himalayan Journal of Community Medicine and Public Health 5, no. 2 (2024): 1-6.
Harvard
Dhatwalia, V. and Chandel, S. (2024) 'Curves of Concern: Public Awareness of Scoliosis and Its Impact on Childhood Development in Hamirpur' Himalayan Journal of Community Medicine and Public Health 5(2), pp. 1-6.
Vancouver
Dhatwalia V, Chandel S. Curves of Concern: Public Awareness of Scoliosis and Its Impact on Childhood Development in Hamirpur. Himalayan Journal of Community Medicine and Public Health. 2024 Jul;5(2):1-6.
Download PDF
Research Article
Etiological Analysis of the Incident of Computer Vision Syndrome (Cvs) in Students of the Faculty of Medical Muhammadiyah University Semarang
Anang Kriswantoro,
...
Swasty
Published: 20/01/2026
Download PDF
Cite
x
APA
Kriswantoro, A., Martiningsih, W. R., Novitasari, A. & None, S. (2026). Etiological Analysis of the Incident of Computer Vision Syndrome (Cvs) in Students of the Faculty of Medical Muhammadiyah University Semarang. Himalayan Journal of Community Medicine and Public Health, 7(1), 1-5.
MLA
Kriswantoro, Anang, et al. "Etiological Analysis of the Incident of Computer Vision Syndrome (Cvs) in Students of the Faculty of Medical Muhammadiyah University Semarang." Himalayan Journal of Community Medicine and Public Health 7.1 (2026): 1-5.
Chicago
Kriswantoro, Anang, Wahju R. Martiningsih, Andra Novitasari and Swasty . "Etiological Analysis of the Incident of Computer Vision Syndrome (Cvs) in Students of the Faculty of Medical Muhammadiyah University Semarang." Himalayan Journal of Community Medicine and Public Health 7, no. 1 (2026): 1-5.
Harvard
Kriswantoro, A., Martiningsih, W. R., Novitasari, A. and None, S. (2026) 'Etiological Analysis of the Incident of Computer Vision Syndrome (Cvs) in Students of the Faculty of Medical Muhammadiyah University Semarang' Himalayan Journal of Community Medicine and Public Health 7(1), pp. 1-5.
Vancouver
Kriswantoro A, Martiningsih WR, Novitasari A, Swasty S. Etiological Analysis of the Incident of Computer Vision Syndrome (Cvs) in Students of the Faculty of Medical Muhammadiyah University Semarang. Himalayan Journal of Community Medicine and Public Health. 2026 Jan;7(1):1-5.
Download PDF
Research Article
Silent Threats Unveiled: Gauging Public Awareness and Understanding of Blood Clotting Disorders in Ambala, Haryana
Ashmita Joshi,
...
Sanjeev Kumar
Published: 30/07/2024
Download PDF
Cite
x
APA
Joshi, A., kaur, J. & Kumar, S. (2024). Silent Threats Unveiled: Gauging Public Awareness and Understanding of Blood Clotting Disorders in Ambala, Haryana. Himalayan Journal of Community Medicine and Public Health, 5(2), 1-6.
MLA
Joshi, Ashmita, Jasleen kaur and Sanjeev Kumar. "Silent Threats Unveiled: Gauging Public Awareness and Understanding of Blood Clotting Disorders in Ambala, Haryana." Himalayan Journal of Community Medicine and Public Health 5.2 (2024): 1-6.
Chicago
Joshi, Ashmita, Jasleen kaur and Sanjeev Kumar. "Silent Threats Unveiled: Gauging Public Awareness and Understanding of Blood Clotting Disorders in Ambala, Haryana." Himalayan Journal of Community Medicine and Public Health 5, no. 2 (2024): 1-6.
Harvard
Joshi, A., kaur, J. and Kumar, S. (2024) 'Silent Threats Unveiled: Gauging Public Awareness and Understanding of Blood Clotting Disorders in Ambala, Haryana' Himalayan Journal of Community Medicine and Public Health 5(2), pp. 1-6.
Vancouver
Joshi A, kaur J, Kumar S. Silent Threats Unveiled: Gauging Public Awareness and Understanding of Blood Clotting Disorders in Ambala, Haryana. Himalayan Journal of Community Medicine and Public Health. 2024 Jul;5(2):1-6.
Yadav, T. & Swaroop, S. (2023). Role of Histo-Hepato Biomarkers in Prediction and Prognosis of Hepatitis-B Infections on Uttar Pradesh Population. Himalayan Journal of Community Medicine and Public Health, 4(2), 1-5.
MLA
Yadav, Tanu and Suchit Swaroop. "Role of Histo-Hepato Biomarkers in Prediction and Prognosis of Hepatitis-B Infections on Uttar Pradesh Population." Himalayan Journal of Community Medicine and Public Health 4.2 (2023): 1-5.
Chicago
Yadav, Tanu and Suchit Swaroop. "Role of Histo-Hepato Biomarkers in Prediction and Prognosis of Hepatitis-B Infections on Uttar Pradesh Population." Himalayan Journal of Community Medicine and Public Health 4, no. 2 (2023): 1-5.
Harvard
Yadav, T. and Swaroop, S. (2023) 'Role of Histo-Hepato Biomarkers in Prediction and Prognosis of Hepatitis-B Infections on Uttar Pradesh Population' Himalayan Journal of Community Medicine and Public Health 4(2), pp. 1-5.
Vancouver
Yadav T, Swaroop S. Role of Histo-Hepato Biomarkers in Prediction and Prognosis of Hepatitis-B Infections on Uttar Pradesh Population. Himalayan Journal of Community Medicine and Public Health. 2023 Jul;4(2):1-5.



 Download PDF
 Download XML