Business Process Outsourcing is the act of outsourcing some aspect of your business’s operations to a third-party vendor or service provider. A BPO call center is a team of outsourced agents who handle incoming and outgoing customer calls for other businesses. Philips Personal Health APAC is one of the accounts of Hinduja Global Solutions, one of the Top BPO Industries in the Philippines,that was established and started its operation on August 06, 2018. The starting headcount of the account is 58 employees that includes an Operations Manager, Team Leaders, Analysts, Voice Agents and Non-Voice Agents. In this study, it will focus on the Service Level of Philips Personal Health APAC. Service level is an important KPI that measures the degree of accessibility of a call center to their customers. Service level can have a large impact on service quality, and as a result, revenue. It is therefore imperative that management constantly measure service level over time and engage in preventative or reparative tactics to help enhance service level when it slips.
Keywords
Business Process Outsourcing
Philips Personal Health APAC
Hinduja Global Solutions
BPO
Service Level
KPI
INTRODUCTION
Business Process Outsourcing is the act of outsourcing some aspect of your business’s operations to a third-party vendor or service provider. A BPO call center is a team of outsourced agents who handle incoming and outgoing customer calls for other businesses.
Philips Personal Health APAC is one of the accounts of Hinduja Global Solutions, one of the Top BPO Industries in the Philippines, that was established and started its operation on August 06, 2018. The starting headcount of the account is 58 employees that includes an Operations Manager, Team Leaders, Analysts, Voice Agents and Non-Voice Agents.
It handles different clients and customers across different countries in Asia Pacific, that is why the account is commonly known as “APAC”. The countries it handles are Australia, New Zealand, Singapore, Philippines, Malaysia, Indonesia, Thailand, and Vietnam.
The Hours of Operation (HOOP) within the day starts at 04:00 AM up to 07:00 PM daily except Sunday. It has different LOBs or Line of Business and what agents mostly do for entire day are to take calls (inbound calls) and call customer back (outbound calls), reply and send emails, engage in a chat and send an update to WhatsApp.
It was a great two successful years for the Philips APAC since it started its operation until recently, the account encountered some issues such as having a failed Service Level to some counties and such other factors, making the account ineffective for the month of January. The Overall Service Level of Philips APAC for the month of January is 76.72%. However, the passing Service level for the entire account is 80%.
This study aims to identify the factors why the Philips APAC wasn’t able to perform well for the month of January 2021 and will be having a further discussion on how to improve the performance of the agents and how they will be handled efficiently and effectively by the Superior or Leaders.
Proposed Intervention, Innovation and Strategy
The research will target on how to pass the Service Level of the account because it is the primary data that are being asked by the Head Clients. Having said that, it will include the strategies and resolutions in solving the issue such as adding manpower, accurate forecasts in manning the people wisely and other related discussions correlated to the workforce. In addition to this, other strategies that can be formulated are to Optimize occupancy rates, increase schedule adherence, improve call forecasting, reduce agent attrition, enable agent call-backs, enhance FCR or First Call Resolution, enhance customer satisfaction, and etc. These strategies will be further discussed in the following section, (VIII. Work Plan and Timeline)
The variables or measurements to be used for this study is first, the Service Level. Service level is an important KPI that measures the degree of accessibility of a call center to their customers. Service level can have a large impact on service quality, and as a result, revenue. It is therefore imperative that management constantly measure service level over time and engage in preventative or reparative tactics to help enhance service level when it slips. Aside from Service Level, we will also look for possible factors or reasons why the Philips APAC failed its performance for the month of January such as the Overall Abandon Rate, which defined as the percentage of inbound phone calls made to a call center or service desk that is abandoned by the customer before speaking to an agent. It is calculated as the total number of abandoned calls divided by total inbound calls. Average Handling Time of the Voice Agents could also be one of the performance outliers as it is defined as the average duration of an interaction with a customer, usually measured from the customer's initiation of the call and covering all talk time and hold time until the end of the call. Lastly, we can also check on the Absenteeism Rate, the percentage of unauthorized time that members of the Contact Centre team are absent from the floor. It is also known as “absence rate”.
BPO companies are unique because of its openness to everyone. Creating opportunity not just to those highly qualified but for those who are willful, striving and skillful. It also gives thousands of opportunities for promotion not just for degree holders but for those who are passionate about the job. It can turn you to a Grammar Nazi, a Mechanical Engineer, a Healthcare Provider, an Adviser and many more. Aside from the vast opportunities, it values employee’s effort and loyalty that makes BPO known to this country.
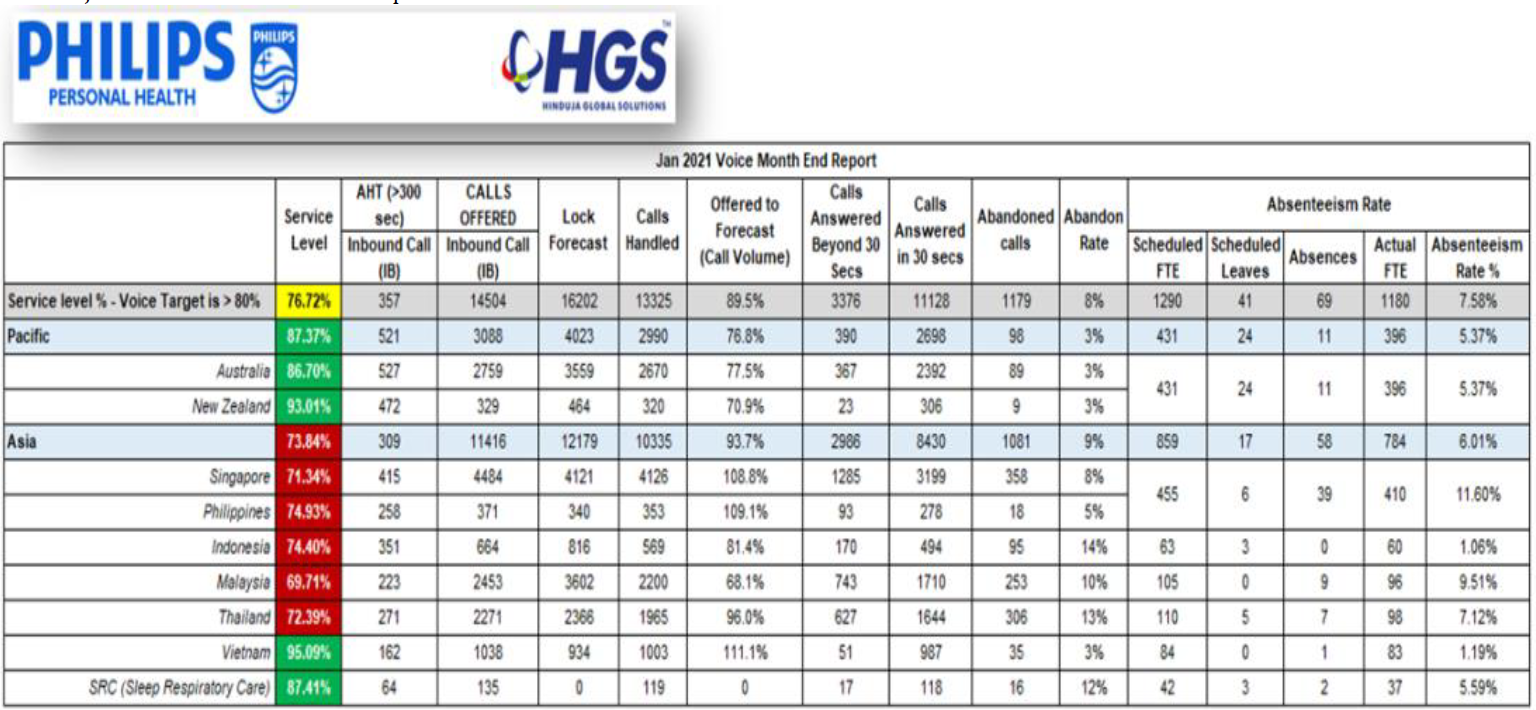
The Table 1 shows the Overall Metrics of Philips APAC performance for the Month of January 2021. On the Service Level Column, it is obvious that the markets who only passed are Australia, New Zealand, Vietnam and SRC (Sleep Respiratory Care), and the markets who failed were the ones who are highlighted in red including Singapore, Philippines, Indonesia, Malaysia and Thailand.
SRC (Sleep Respiratory Care) – does not have Forecast value. Because the Head Clients want for this LOB or Line of Business is the number of actual calls that are being answered, yet, they are still included in the computation of Service Level.
Table 1. Jan 2021 Voice Month End Report
Furthermore, the Researcher Posed the Following Questions
What are the possible reasons why the Service Level of Philips APAC failed for the month of January 2021
What are the strategies needed to formulate in order to maintain a passing Service Level for the entire account
Research Design
Descriptive research is used in this study and for the purpose of answering the research question, the researcher collected qualitative data. This design offers the access to the ideas, experiences and strategies brought about by Philips APAC to the research participants.
Population and Sampling
The population of Philips APAC consists of 74 headcounts as of today. Since I opted to collect qualitative data, the study can be conducted with small samples. Most of the questions provided are for Supervisory or Support people, thus, 16 people responded to the questions. Five Team Leaders, 4 Workforce Management People (2 Real Time Analysts, 1 Reports Analysts, 1 Senior Specialists), 3 ITs, 2 Quality Assurance, 1 Line Trainer and 1 Operations Manager.
Data Collection Method
The qualitative data collection technique used in the study comprises an open-ended survey and questionnaires. It allows respondents much more freedom and flexibility when providing their answers. With an online survey questionnaire, it was possible to collect qualitative data from the selected samples. And for its advantage, respondents were able to take the survey on any device, be it a desktop, tablet, or mobile.
Participants and/or Other Sources of Data
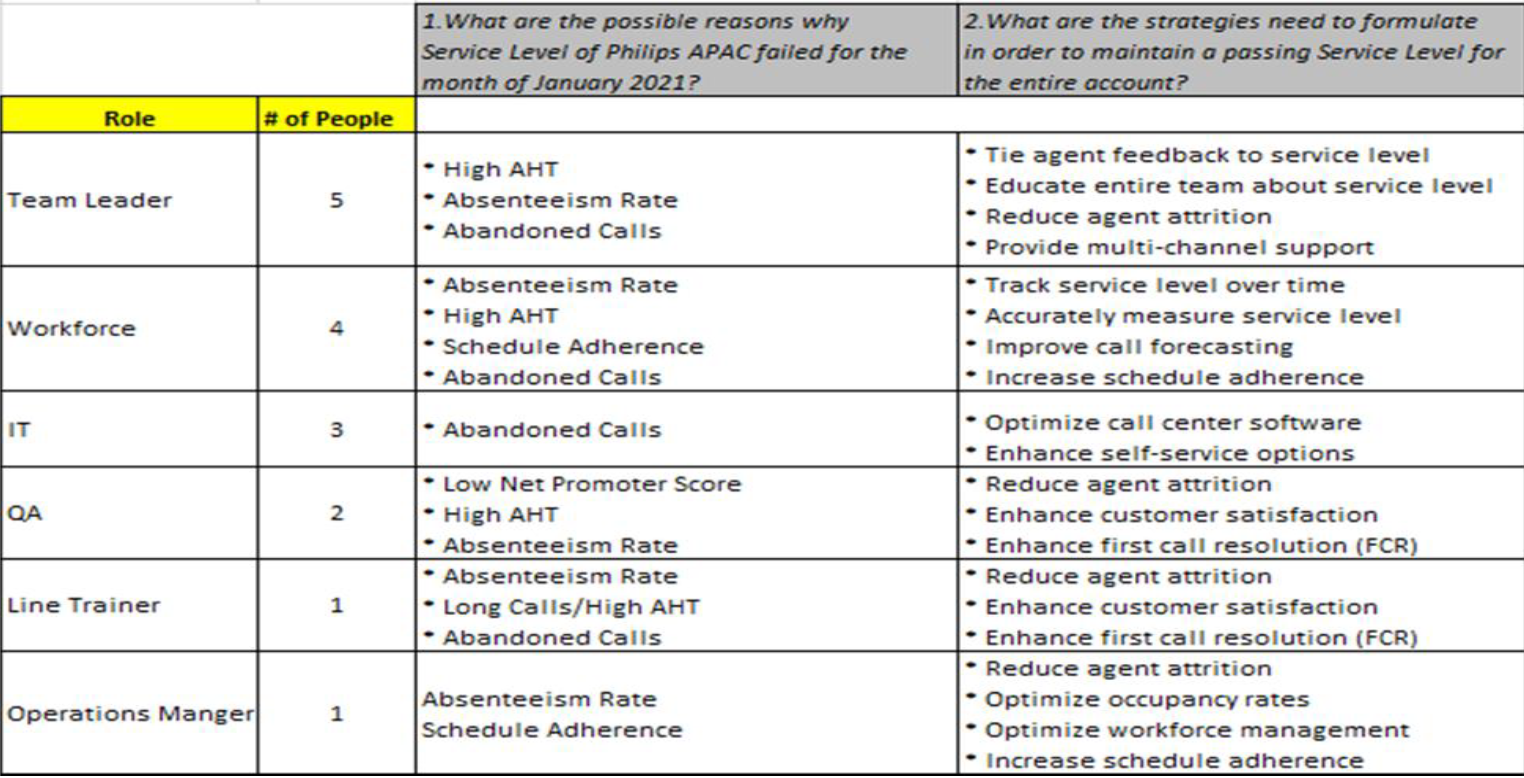
Table 2 shows all the group answers to the Research Question. Majority of the group believes that the reason why Service Level failed for the month of January 2021 is due to Absenteeism Rate.
Table 2: Group Discussion/Interview
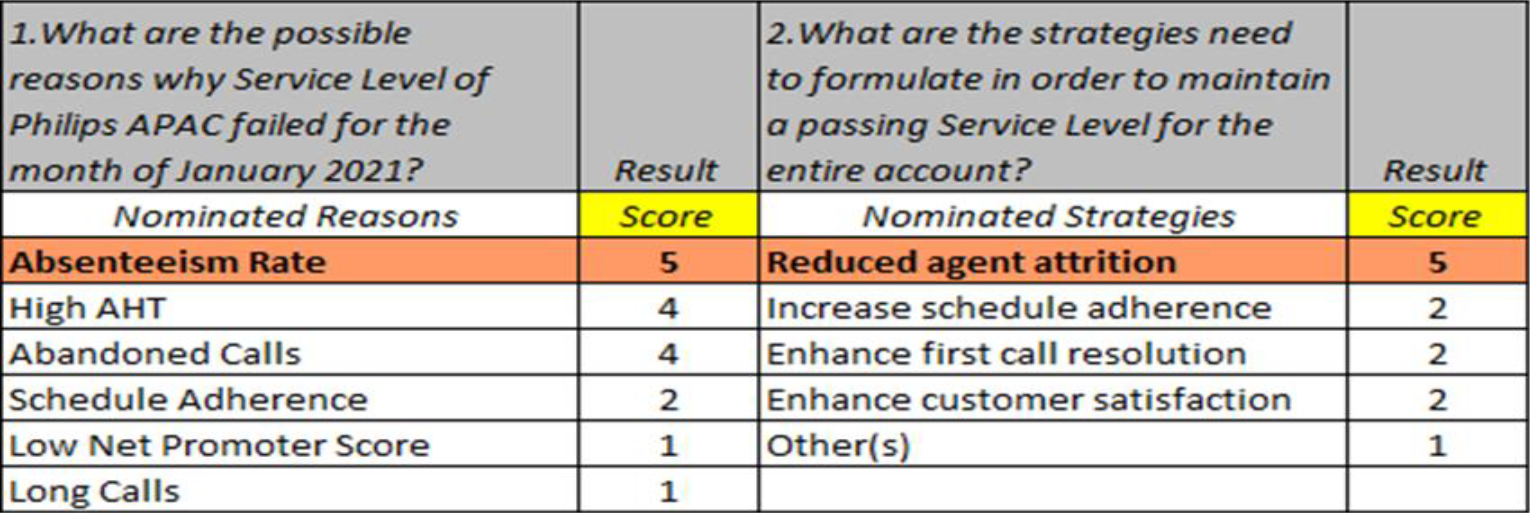
Based on the result in Table 3, the Top Reason why Service Level failed is because of High AHT or Average Handling Time. If the majority of the agents will have a High AHT, it simply means that they have issues with the calls they are taking in. Thus, it will lead to Long Calls that cause the account to increase the number of abandoned calls. Therefore, by combining all the failing metrics, it will have a big impact on the Service Level.
According to the result as well, the top recommendation to have this issue resolved is to reduce agent attrition. Of course, that will be possible if the employees are motivated to work, and there will be at least more than additional agents to take in calls just to make sure that all calls will be answered ahead of time.
Table 3: Interpretation of Result
Data Gathering Methods
Group Discussion is the tool that was used in answering the questions. People from different roles in the Philips APAC share their thoughts and opinions about the question and discuss it with the Team before handing it over to researchers.
The content of the data consists of the reasons why Service Level failed and what are the suggested action plans to be implemented. They will measure the capacity of the people who will be in charge of taking calls and will forecast if it will be enough to suffice the needs of the customers.
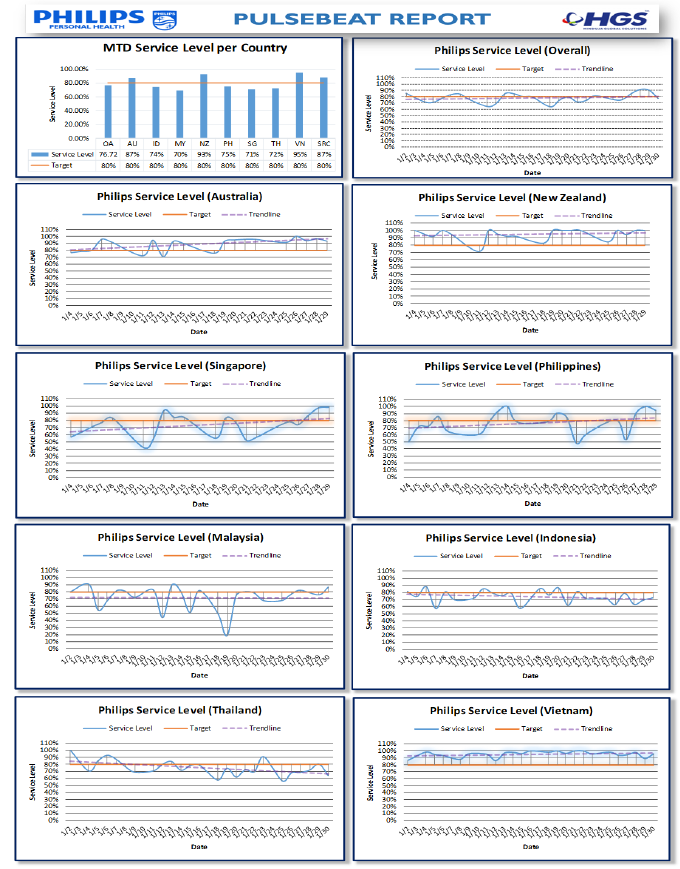
Figure 1 shows the Pulsebeat Report for Philips APAC presented in a graph per market. Per graph, it has the Service Level and the dates and it clearly shows how Service Level was changing per day. The first two graphs show different interpretations of the Service Level for the Month of January 2021.
Figure 1: MTD Service Level Report by Country – Philips Personal Health
Work Plan and Timeline
Given the formulated action plan earlier in the question #2, here are the things to consider in enhancing the Service Level:
Optimize Workforce Management
Workforce management involves forecasting call volumes, scheduling the optimal number of agents to work at any given day or period of time throughout the day, creating schedules for each agent and making adjustments to the workforce as needed. This is a complex task that involves taking into account:
Historical call volume trends
Target service level
The number of agents available (i.e. accounting for agents arriving late, absenteeism, sick days, vacation days, etc.)
Upcoming marketing campaigns, product promotions and product launches
Time agents spend on calls and after call work
Time spent providing support on different channels (i.e. chat, email, phone, social media, etc.)
Breaks, trainings and meetings
It is also essential that managers build in some flexibility when scheduling their workforce and anticipate that unplanned events will happen (i.e. agents call in sick, have to leave early, take longer breaks than expected, require more training, etc.) and that call volumes will fluctuate as they are somewhat unpredictable.
When workforce management is not optimized, it can have a large impact on both service level and the company’s bottom line. Understaffing results in fewer agents fielding calls, longer wait times and a decline in service level. Overstaffing results in more available agents, shorter wait times and an increase in service level, however overstaffing is more costly and can negatively impact the budget. Thus, optimizing workforce management is the key to enhancing service level.
Optimize Occupancy Rates
Occupancy rate is the percentage of time that agents are performing work-related duties (i.e. talking with customers, performing after call work like updating databases, sending emails, etc.) vs. the total time that they are logged in. An example of an occupancy rate equation is:
Occupancy rate = (total call handing and after call work time – idle time) / total logged in time
Occupancy rates are typically inversely proportional to service level. High occupancy rates indicate that agents are less available to field calls, callers wait longer and service level declines. Low occupancy rates indicate that agents are more available to field calls, calls are answered immediately and service level increases.
Occupancy rates that are too high (i.e. over 90%) are indicative of an extreme workload for agents. This typically results in increased agent stress, decreased agent effectiveness, decreased agent satisfaction and increased agent turnover. Occupancy rates that are too low are typically indicative of less than optimal workforce management and can increase costs (as more agents are on staff than necessary), increase agent boredom and decrease agent satisfaction. Thus, management should strive to create a balance between optimizing occupancy rates and service level.
Increase Schedule Adherence
While workforce management is essential to ensuring that the optimal number of agents are scheduled to field calls, service level will not improve unless the agents adhere to their designated schedules. When agents take longer breaks, take their lunch at an unscheduled time or spend time at their desk on non-work related tasks (i.e. checking social media sites instead of fielding calls) fewer agents will be available to field calls than planned and service level will decline.
It is essential that managers constantly monitor schedule adherence and make staffing adjustments accordingly. Management should also expect that agents will not completely adhere to their schedule 100% of the time and take this into account when making staffing decisions. These changes will positively impact both occupancy rates and service level.
Improve Call Forecasting
Predicting the overall volume and the arrival patterns of calls throughout the day can be a challenging task. This involves analyzing historical ACD data (i.e. call volume, handle times, arrival patterns, etc.) as well as taking into account:
Upcoming marketing campaigns and product promotions
Repeated events (i.e. dates customers are charged, billing due dates, etc.)
Product launches, glitches, bugs, etc.
Market fluctuations and industry trends, events and activities
Weather patterns, natural disasters, power outages, major events (both local and global), etc.
Holidays, days of the week, time of the day
The more comprehensive your call forecasting, the more accurate your workforce management and scheduling and service level will improve
Reduce Agent Attrition
Agent attrition is the percentage of agents that leave their position (i.e. quit, fired or promoted) during a period of time. Decreasing agent attrition rates will ensure that your team will be more proficient with handling calls, navigating your business tools and up-to-date on the ins and outs of your company and product. This will increase their overall efficiency and effectiveness, customer satisfaction and their availability to field calls. Taken together, all the aforementioned factors will contribute to enhancing service level.
Enable Agent Call-Backs
When waiting time is increasing and service level is declining, a quick, in the moment solution to increasing service level and customer satisfaction is to enable agent call-backs. Call center software that informs the caller of the anticipated wait time and provides them the option to opt out of waiting in the queue and receive a call-back from the agent can dramatically improve service level. When implementing this tool, it is important for managers to correctly classify the call (i.e. answered vs. abandoned) so their service level performance metric is accurate.
Enhance First Call Resolution (FCR)
Enhancing FCR can significantly increase service level. When callers are routed to the most appropriate agent to meet their needs and their agent resolves their issue without transferring them, not only is the customer more satisfied (and less likely to call back about the same issue) but the agents within the team will be more available to field calls. Both factors, more satisfied customers and more available agents, will enhance service level.
Enhance Customer Satisfaction
Customers that are not satisfied with the service they receive are more likely to call back about the same issue, to ask to be transferred to an agent with more experience or to ask to speak with a manager. All of the aforementioned scenarios can lead to an increase in average handle time as well as the volume of calls and if workforce management doesn’t take these factors into consideration, service level will decline. Thus, enhancing customer satisfaction can dramatically improve service level.
Provide Multi-Channel Support
Offering support via email, chat, self-help guides and FAQ posted online can reduce the volume of inbound calls to your call center. When offering multi-channel support, it is important to respond to support requests via chat and email in a timely manner. Otherwise, customers are likely to also call your support center, two tickets will be open for the same issue, productivity will decline and so will service level (as valuable time will be diverted from answering calls to replying to a redundant support request).
Enhance Agent Competency
Agent competency has a direct effect on service level. Competent agents are more likely to resolve the caller’s issue quickly and comprehensively, increase customer satisfaction, decrease the likelihood that the customer will call back and decrease the likelihood that the call will be transferred or escalated to a manager. Additionally, competent agents are more efficient and accurate with data entry when updating business tools, thus reducing after call work time, increasing their availability to field calls and enhancing FCR when the caller calls back about another issue (as the information in the system will be up-to-date for the next agent). Finally, skilled agents will also reduce the workload burden on other departments (i.e. tech support, sales, etc.) as they will be more likely to meet these basic needs without having to transfer the call. Taken together, the more competent the agent or team, the higher the service level.
Employ On-Call Agents
No matter how comprehensive your workforce management strategy, there is inherent variability in call volume and schedule adherence within a call center. Managers should prepare for this by employing a workforce of on-call agents, or cross-training agents within the company to field different types of calls (i.e. support, IT, etc.). Hiring an at-home workforce of on-call call center agents can be a very cost-effective solution to this problem. Additionally, utilizing browser-based call center software that has pay-as-you-go options and charges per hour of usage can also be extremely useful when employing an at-home workforce of on-call agents.
Accurately Measure Service Level
Only when service level is carefully defined and accurately measured is it useful. It is important to analyze how your team measures service level and make changes when necessary.
Track Service Level Over Time
The key to making data-driven decisions to enhance service level is to track changes in service level, both in the moment and over time. Having call center software that allows you to customize your service level time threshold, track service level over discrete time periods that are most meaningful to your company and monitor changes in service level in real-time is essential to this process.
Learn from Changes in Service Level
Monitoring service level over time and analyzing changes will allow you to engage in more effective troubleshooting, make data-driven decisions and enhance workforce management. All will go a long way to enhancing service level.
Educate You Entire Team About Service Level
It is essential that you train your team about:
What service level is
How service level was defined
How service level is calculated
What their service level objectives are
How they can meet their service level objectives
What happens when they fail to meet their service level objectives (i.e. recruit more staff; ask them to stagger their breaks, etc.)
What happens when they meet their service level objectives (i.e. bonus, leave early, longer lunch break, etc.)
By doing so you are increasing the likelihood that they will make decisions that will enhance service level and may also lead to an increase in schedule adherence as they will develop more insight into workforce management.
Tie Agent Feedback to Service Level
If you measure agent or team performance based on service levels, giving them concrete evidence to support your feedback is extremely effective in eliciting change in their behavior or when offering a reward. Agents that know what is expected of them (i.e. service level objectives are clear), who can make changes in their approach to answering calls based on readily available service level data and who’s performance evaluation is tied to concrete data (such as service level) will be better equipped to make strategic changes that will positively influence service level for their department and your company as a whole.
Enhance Self-Service Options
Allowing customers to help themselves can drastically increase service level as it will reduce call volume and free up more agents to answer calls quicker. One strategy is to use a self-service IVR. You can upload pre-recorded messages (about your business hours, directions to the office, etc.) into the IVR that will answer some of the most common (and simple) questions. Automating the customer support process frees up your agents to handle more complex calls and increases service level. Another strategy is to enhance your FAQ , resource library and user-friendliness of your website. When your customers can easily find the answers to their questions online, they will be less likely to call your company. Taken together, these two methods will significantly reduce call volume and free up agents to field more important calls, thereby increasing service level.
Optimize Call Center Software
Optimizing your call center software can go a long way in increasing service level. By implementing software that has:
A comprehensive ACD to accurately measure call volume, handle time, calls received and calls abandoned
An effective IVR to partially automate the support process and decrease call volume
Skills-based routing to increase customer satisfaction and enhance FCR
Real-time and historical reporting so agents and managers can keep track of changes in service level
An easy to use interface so agents have the most relevant information at their fingertips
Integrated business tools so agents don’t have to waste time updating the same information into different business tools
Browser-based technology so on-call agents can work from home
Pay-as-you-go pricing so you are only charged for on-call agents when they work you will dramatically increase the efficiency and effectiveness of your team and service level will increase
The 18 aforementioned tools and techniques will go a long way in ensuring that Philips APAC is optimizing service level. Enhancing service level can have a large impact on service quality, company reputation and revenue, thus it is an important KPI to measure and work to optimize overtime.
PLANS fOR Dissemination and Utilization (Of Research Output)
The people within the organization in Philips APAC are the primary core beneficiary of the study. It can also be used and shared to other departments or other BPO companies who will experience the same thing.
Beneficiaries and all the people who will read and understand this study will have knowledge in terms of how to enhance the Service Level and other things related to it. It will be published online and make sure it is downloadable and accessible to everyone.
License
Creative Commons Attribution-NonCommercial-NoDerivatives 4.0 International License
All papers should be submitted electronically. All submitted manuscripts must be original work that is not under submission at another journal or under consideration for publication in another form, such as a monograph or chapter of a book. Authors of submitted papers are obligated not to submit their paper for publication elsewhere until an editorial decision is rendered on their submission. Further, authors of accepted papers are prohibited from publishing the results in other publications that appear before the paper is published in the Journal unless they receive approval for doing so from the Editor-In-Chief.
Himalayan Journal of Economics and Business Management open access articles are licensed under a Creative Commons Attribution-Share A like 4.0 International License. This license lets the audience to give appropriate credit, provide a link to the license, and indicate if changes were made and if they remix, transform, or build upon the material, they must distribute contributions under the same license as the original.
Recommended Articles
Research Article
Influence of Leadership on Poverty Reduction in the Devolved Government in Trans-Nzoia County, Kenya
Kinisu Sifuna,
...
Peter Simotwo
Published: 30/06/2021
Download PDF
Cite
x
APA
Sifuna, K., Lwangale, D. W., Simotwo, P., Sifuna, K., Lwangale, D. W. & Simotwo, P. (2021). Influence of Leadership on Poverty Reduction in the Devolved Government in Trans-Nzoia County, Kenya. Himalayan Journal of Economics and Business Management, 2(1), None-None.
MLA
Sifuna, Kinisu, et al. "Influence of Leadership on Poverty Reduction in the Devolved Government in Trans-Nzoia County, Kenya." Himalayan Journal of Economics and Business Management 2.1 (2021): None-None.
Chicago
Sifuna, Kinisu, David W. Lwangale, Peter Simotwo, Kinisu Sifuna, David W. Lwangale and Peter Simotwo. "Influence of Leadership on Poverty Reduction in the Devolved Government in Trans-Nzoia County, Kenya." Himalayan Journal of Economics and Business Management 2, no. 1 (2021): None-None.
Harvard
Sifuna, K., Lwangale, D. W., Simotwo, P., Sifuna, K., Lwangale, D. W. and Simotwo, P. (2021) 'Influence of Leadership on Poverty Reduction in the Devolved Government in Trans-Nzoia County, Kenya' Himalayan Journal of Economics and Business Management 2(1), pp. None-None.
Vancouver
Sifuna K, Lwangale DW, Simotwo P, Sifuna K, Lwangale DW, Simotwo P. Influence of Leadership on Poverty Reduction in the Devolved Government in Trans-Nzoia County, Kenya. Himalayan Journal of Economics and Business Management. 2021 Jan;2(1):None-None.
Download PDF
Research Article
Modelling Structure Job Quality, Job Design and Job Satisfaction
Moch Nurhadi,
...
Avi Sunani
Published: 30/08/2022
Download PDF
Cite
x
APA
Nurhadi, M., Bisyri Effendi, M., Saiful Ulum, A. & Sunani, A. (2022). Modelling Structure Job Quality, Job Design and Job Satisfaction. Himalayan Journal of Economics and Business Management, 3(2), 1-4.
MLA
Nurhadi, Moch, et al. "Modelling Structure Job Quality, Job Design and Job Satisfaction." Himalayan Journal of Economics and Business Management 3.2 (2022): 1-4.
Chicago
Nurhadi, Moch, Moch Bisyri Effendi, Achmad Saiful Ulum and Avi Sunani. "Modelling Structure Job Quality, Job Design and Job Satisfaction." Himalayan Journal of Economics and Business Management 3, no. 2 (2022): 1-4.
Harvard
Nurhadi, M., Bisyri Effendi, M., Saiful Ulum, A. and Sunani, A. (2022) 'Modelling Structure Job Quality, Job Design and Job Satisfaction' Himalayan Journal of Economics and Business Management 3(2), pp. 1-4.
Vancouver
Nurhadi M, Bisyri Effendi M, Saiful Ulum A, Sunani A. Modelling Structure Job Quality, Job Design and Job Satisfaction. Himalayan Journal of Economics and Business Management. 2022 Jul;3(2):1-4.
Download PDF
Research Article
The Constitutional and Legislative Basis for Considering the Taxable Capacity of Taxpayers in Iraqi Tax Legislation
Hussein Kamel Wadaa
Published: 05/05/2025
Download PDF
Cite
x
APA
Wadaa, H. K. (2025). The Constitutional and Legislative Basis for Considering the Taxable Capacity of Taxpayers in Iraqi Tax Legislation. Himalayan Journal of Economics and Business Management, 6(1), 1-10.
MLA
Wadaa, Hussein Kamel. "The Constitutional and Legislative Basis for Considering the Taxable Capacity of Taxpayers in Iraqi Tax Legislation." Himalayan Journal of Economics and Business Management 6.1 (2025): 1-10.
Chicago
Wadaa, Hussein Kamel. "The Constitutional and Legislative Basis for Considering the Taxable Capacity of Taxpayers in Iraqi Tax Legislation." Himalayan Journal of Economics and Business Management 6, no. 1 (2025): 1-10.
Harvard
Wadaa, H. K. (2025) 'The Constitutional and Legislative Basis for Considering the Taxable Capacity of Taxpayers in Iraqi Tax Legislation' Himalayan Journal of Economics and Business Management 6(1), pp. 1-10.
Vancouver
Wadaa HK. The Constitutional and Legislative Basis for Considering the Taxable Capacity of Taxpayers in Iraqi Tax Legislation. Himalayan Journal of Economics and Business Management. 2025 Jan;6(1):1-10.
Download PDF
Research Article
Proposed Digital Marketing Strategy to Enhance Engineering Consultancy Company Revenue
Alfarisy, K. A.,
Wandebori, H.
Published: 30/04/2024
Download PDF
Cite
x
APA
K. A., A. & H., W. (2024). Proposed Digital Marketing Strategy to Enhance Engineering Consultancy Company Revenue. Himalayan Journal of Economics and Business Management, 5(1), 1-18.
MLA
K. A., Alfarisy, and Wandebori, H.. "Proposed Digital Marketing Strategy to Enhance Engineering Consultancy Company Revenue." Himalayan Journal of Economics and Business Management 5.1 (2024): 1-18.
Chicago
K. A., Alfarisy, and Wandebori, H.. "Proposed Digital Marketing Strategy to Enhance Engineering Consultancy Company Revenue." Himalayan Journal of Economics and Business Management 5, no. 1 (2024): 1-18.
Harvard
K. A., A. and H., W. (2024) 'Proposed Digital Marketing Strategy to Enhance Engineering Consultancy Company Revenue' Himalayan Journal of Economics and Business Management 5(1), pp. 1-18.
Vancouver
K. A. A, H. W. Proposed Digital Marketing Strategy to Enhance Engineering Consultancy Company Revenue. Himalayan Journal of Economics and Business Management. 2024 Jan;5(1):1-18.
Muyot, J. N. C. (2021). Service Level Analysis of Philips APAC : For the month of January 2021. Himalayan Journal of Economics and Business Management, 2(1), 1-7.
MLA
Muyot, Jonathan N. C.. "Service Level Analysis of Philips APAC : For the month of January 2021." Himalayan Journal of Economics and Business Management 2.1 (2021): 1-7.
Chicago
Muyot, Jonathan N. C.. "Service Level Analysis of Philips APAC : For the month of January 2021." Himalayan Journal of Economics and Business Management 2, no. 1 (2021): 1-7.
Harvard
Muyot, J. N. C. (2021) 'Service Level Analysis of Philips APAC : For the month of January 2021' Himalayan Journal of Economics and Business Management 2(1), pp. 1-7.
Vancouver
Muyot JNC. Service Level Analysis of Philips APAC : For the month of January 2021. Himalayan Journal of Economics and Business Management. 2021 Jan;2(1):1-7.



 Download PDF
 Download XML