Based upon the information of the Consumer Confidence Index (“CCI”), the stocks of consumer companies in Indonesia are still attractive for their investors. The selection process for the investors can be narrowed down to using available stock indexes that are available in the market. The LQ45 Index is one option in selecting large caps stocks. Furthermore, there are various methods that are being used by investors in order to determine whether a company stock will generate a good return. In this research, the researcher chooses to highlight the benefit of knowing the relationship between financial ratios of a company and the stock returns of the same company. This research focuses in analyzing the relationship between selected financial ratios which are Current Ratio (CR), Liabilities to Assets (LTA), Return on Asset (ROA), Net Profit Margin (NPM), Dividend Payout Ratio (DPR) and the Stock Returns of the consumer companies that are listed in LQ45 Index in the period from 2017 to 2022. We used EVIEWS 10's multiple regression analysis approach to examine all of the data. This study additionally employs hypothesis testing, a coefficient of determination test, and assumption tests to round out the investigation. Findings from this study indicate that, for the consumer businesses included in the LQ45 Index from February 2023 to July 2023, Return on Asset (ROA), Net Profit Margin (NPM), and Dividend Payout Ratio (DPR) do, in fact, interact significantly with stock returns. While, Current Ratio (CR) and Liabilities to Asset (LTA) do not have a significant relationship toward the same. All the independent variables simultaneously influence Stock Return.
Keywords
Financial Ratios
Multiple Regression Analysis
Stock Return
INTRODUCTION
Background to the Study
Countries throughout the globe are presently undergoing the recovery phase as they face the immense challenge posed by the COVID-19 epidemic. In addition, the Russia-Ukraine War, supply chain interruptions, record degrees of inflation, and spikes in commodity prices have all had an impact on global trends during the last three years, along with the COVID-19 epidemic and its aftermath. Inflation in 2022 reached a three-decade high, prompting several central banks worldwide to swiftly tighten their monetary policies. There was a three-decade high of 7.0% annual growth in the worldwide Consumer Price Index ("CPI") in 2022. Food, gasoline, and energy costs were the primary drivers of the inflationary pressure. Inflation in the United Kingdom was 9.0 percent in 2022, the highest rate among the G7 nations. Then came Germany and Italy, with inflation rates of 8.2% and 8.5%, respectively. Consumers have taken the brunt of inflationary pressure in the majority of industrialized nations. Imposing export restrictions on Russia and causing havoc in the global supply chain drove up commodity and energy prices across the globe, particularly in the European Union. Around 10% of the world's oil comes from Russia. The country also produces a number of other foodstuffs and raw resources, such as sunflower oil, fertilizers, and wheat. All seven G7 nations saw inflationary pressure in 2022 due to cost constraints in Russian commodity-dependent businesses [1].
In spite of widespread concerns about a recession, the world's financial markets have shown remarkable stability throughout the last three years. Volatility Index ("VIX") and systemic risk ("SRISK") assessments of global financial market volatility have not shown any sudden increase or decrease, with the exception of the beginning of the COVID-19 pandemic in Q1 2020. As economies started to recover from the pandemic in the first quarter of 2021, volatility decreased; but, in Q1 2022, volatility spiked again as a result of the conflict in Ukraine. Declined to their lowest points in over three months, the VIX and SRISK both hit rock bottom in 2022. Investors' growing optimism on the stock market's future probably caused the drop [1]. Despite growing prices, consumer confidence in Indonesia has been relatively constant.
In contrast to the surge in inflation in 2022 and the 4% inflation rate recorded at the end of 2022, the Consumer Confidence Index ("CCI") has remained relatively steady throughout the year, with a compound annual growth rate ("CAGR") of 0.02% [1].
This research focuses on consumer companies in the LQ45 Index. Based upon the information of the Consumer Confidence Index (“CCI”), the stocks of consumer companies in Indonesia are still attractive for their investors. The selection process for the investors can be narrowed down to using available stock indexes that are available in the market. The LQ45 Index is one option in selecting large caps stocks. The reason for this is the known criteria that is applied to stocks before they are listed among the 45 companies in the LQ45 Index. Members of the LQ45 Index must meet certain requirements in order to be included in the index. These include, but are not limited to, being one of the 45 companies in the past 12 months with the highest market capitalization, having been listed on the Indonesia Stock Exchange for a minimum of three months, and having strong financial conditions, promising future prospects, and competent corporate management.
Seeing the fact that the Consumer Confidence Index has followed a relatively stable trend, consumer company stocks remain attractive for Indonesian investors. However, investors might keep their bullishness behavior for a while according to the development of the world economy as presented in the preceding paragraphs. There are various methods that are being used by investors in order to determine whether a company stock will generate a good return. In this research, the researcher chooses to highlight the benefit of knowing the relationship between financial ratios of a company and the stock returns of the same company. Financial ratios are widely known and often are easily available. The researcher has already selected a number of important financial measures that investors often employ for this study, which are Current Ratio (CR) as an indicator for liquidity, Liabilities to Asset Ratio (LTA) that shows the percentage of assets that are being funded by liabilities, Return on Asset Ratio (ROA) as an indicator for profitability, Net Profit Margin (NPM) that shows the percentage of net profit to total revenue, and Dividend Payout Ratio (DPR) that shows the amount of dividends distributed to shareholders in relation to the total amount of net income the company generates.
This research observes eight consumer companies that are listed in the LQ45 Index in the period from 2017 to 2022. They are PT Ace Hardware Indonesia Tbk (ACES.JK), PT Sumber Alfaria Trijaya Tbk (AMRT.JK), PT Indofood CBP Sukses Makmur Tbk (ICBP.JK), PT Indofood Sukses Makmur Tbk (INDF.JK), PT Unilever Indonesia Tbk (UNVR.JK), PT Charoen Pokphand Indonesia Tbk (CPIN.JK), PT Japfa Comfeed Indonesia Tbk (JPFA.JK) and PT Surya Citra Media Tbk (SCMA.JK).
Theoretical Review
Financial Ratio Analysis: The purpose of ratio analysis is to extract meaningful numerical relationships from financial statements. It is a method for understanding a company's financial health by analyzing its balance sheet and income statement using certain accounting ratios. To do this, we must compare the current ratios to the previously established norms. Management may establish these standards as budgetary objectives (i.e., a budgetary standard), or they may be based on prior performance data of the same business (i.e., a historical standard), or they may be reflective of data from competing businesses (i.e., industrial market standard) [2]. In and of itself, ratios are not very useful management tools; at most, they are indications. To provide a qualitative assessment of the company's financial performance and to summarize massive amounts of financial data, the ratios are useful [2]. The following are some of the categories of financial ratios:
Liquidity Ratios: A company's short-term solvency and liquidity may be assessed with the use of liquidity ratios. It helps to determine whether the assets can cover the short-term debts. Also shown by this ratio is whether or not a company has sufficient working capital to undertake day-to-day operations [2].
Solvency Ratios: The term "solvent organization" describes a company whose assets exceed its obligations. When a company is solvent, it means it can pay its bills when they come due [2].
Profitability Ratios: A company's ability to turn a profit may be seen via ratios. The end outcome of many policies and initiatives is profitability. Thus far, we have shown that the ratios studied provide helpful hints as to how well a company's operations are running. However, the profitability ratios take it a step further by showing how debt, asset management, and liquidity all contribute to operational performance [3].
Stock Returns
When doing an investment study, one of the most crucial factors is the stock's return. One measure of an investment's success is its return on investment, or return on stock [4].
Conceptual Framework
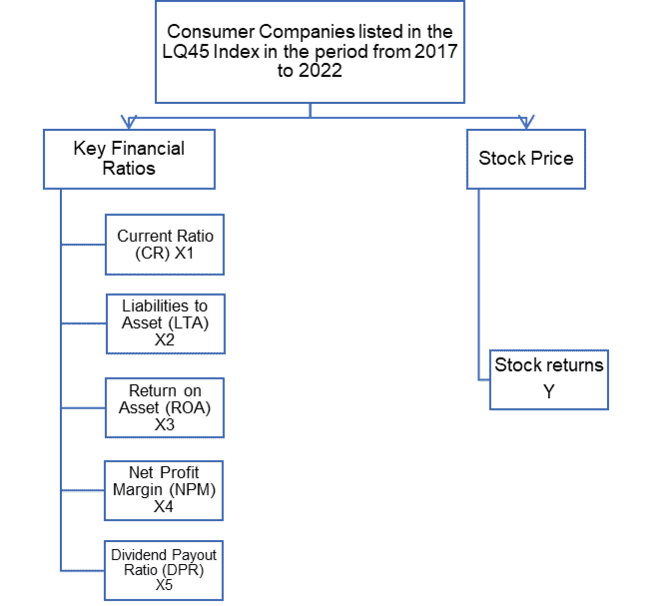
This research is using public listed companies in IDX, specifically consumer companies that are listed in the LQ45 Index in the period from February 2023 to July 2023. The researcher chooses to use the following ratios; liquidity ratio, debt management ratio, and profitability ratio.
Table 1: Sample Companies
No.
Company Ticker Code
Company Name
1
Aces.Jk
PT Ace Hardware Indonesia Tbk
2
Amrt.Jk
PT Sumber Alfaria Trijaya Tbk
3
Icbp.Jk
PT Indofood CBP Sukses Makmur Tbk
4
Indf.Jk
PT Indofood Sukses Makmur Tbk
5
Unvr.Jk
PT Unilever Indonesia Tbk
6
Cpin.Jk
PT Charoen Pokphand Indonesia Tbk
7
Jpfa.Jk
PT Japfa Comfeed Indonesia Tbk
8
Scma.Jk
PT Surya Citra Media Tbk
Source: Researcher’s Own Work
Figure 1: Conceptual Framework
MATERIALS AND METHODS
Research Method
Research design comprises the technique and research methods that are used or conducted during the period of the research. This research in particular is quantitative research in which the researcher intend to analyze the relationship between the selected financial ratios and the stock returns. In this research, the researcher has decided to use the correlational research. By analyzing statistical data, correlational research seeks to ascertain the strength of a link between many variables. It has been determined that correlational research will be used in this study. Using statistical data, correlational research endeavors to ascertain the strength of a link between many variables.
The researcher is using the online data base such as the IDX website, Yahoo Finance website, and other supporting websites to obtain data in a digital basis, among others, the financial statement report, financial ratios (Current Ratio (CR), Liabilities to Assets (LTA), Return on Asset (ROA), Net Profit Margin (NPM), and Dividend Payout Ratio (DPR)) and weekly stock price in order to calculate the Stock returns for all sample companies. This research will analyze the relationship of the selected financial ratios CR, LTA, ROA, NPM, and DPR toward the Stock returns of the selected consumer goods companies on the LQ45 Index, using statistical analysis, namely the Multiple Regression Analysis for panel data type. Specifically, the researcher will use EVIEWS 10 as the statistical tools for the analysis.
RESULTS
Results and Discussion
Estimation of Panel Data Regression Model
The first step is to analyze the data using the three available models for panel data, as below.
Common Effect Model Result (CEM)
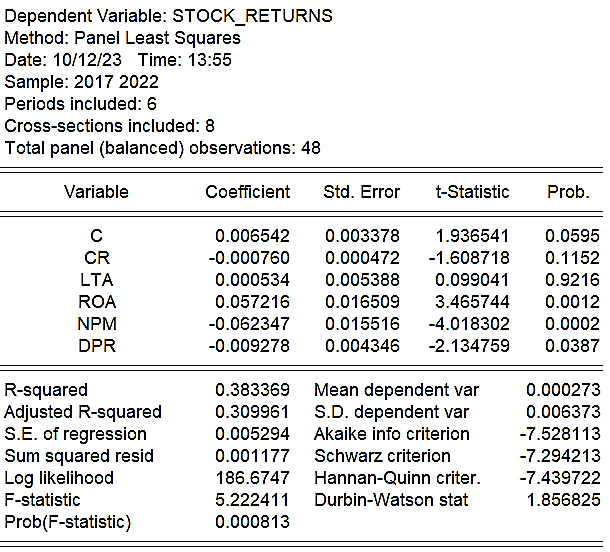
No consideration of time or particular dimensions is made in this model. A least square methodology or Ordinary Least Square (OLS) approach may be used to estimate the panel data model via this way. The following is the result of running the data in a common effect model in EViews.
Figure 2: Common Effect Model of the Research Data
Source: Researcher’s own work
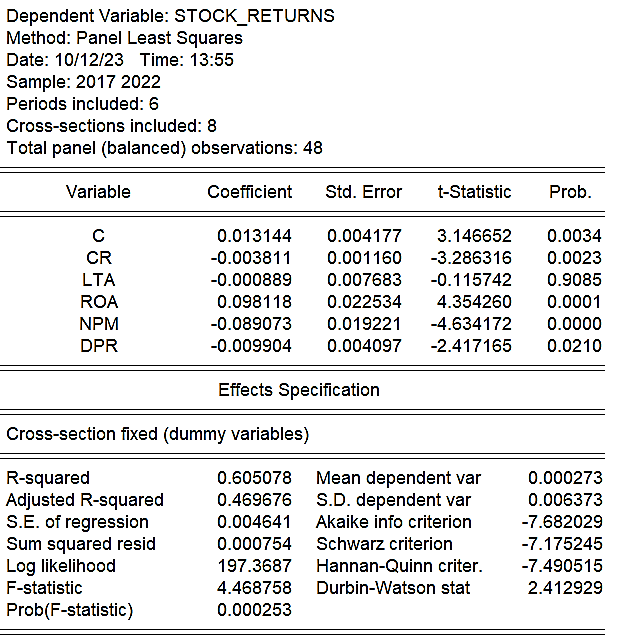
Figure 3: Fixed Effect Model of the Research Data
Source: Researcher’s own work
Fixed Effect Model Result (FEM)
When working with panel data, the Fixed Effects regression model is useful for estimating the impact of individuals' inherent traits. Bear in mind that the FEM presupposes that the regressors' (slope) coefficients remain constant both across individuals and across time. The following is the result of running the data in a fixed effect model in EViews.
Random Effect Model (REM)
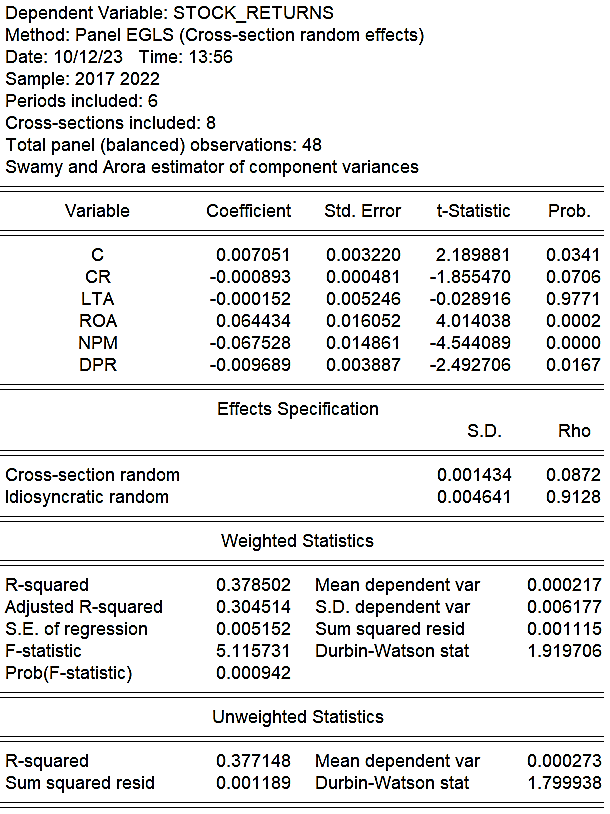
For the purpose of estimating the impact of intrinsically immeasurable individual-specific features, the random effect regression model is used. According to [5], an alternative to the fixed effects model is called the random effect model. The following is the result of running the data in a random effect model in EViews.
Upon having the results of all three models, the researcher is going to determine which model is the best model. According to [6], The Chow Test, the Hausman Test, and the Lagrange Multiplier Test are among the several tests that may be conducted in order to choose the best model.
Figure 4: Random Effect Model of the Research Data
Source: Researcher’s own work
Figure 5: Result of the Chow Test
Source: Researcher’s own work
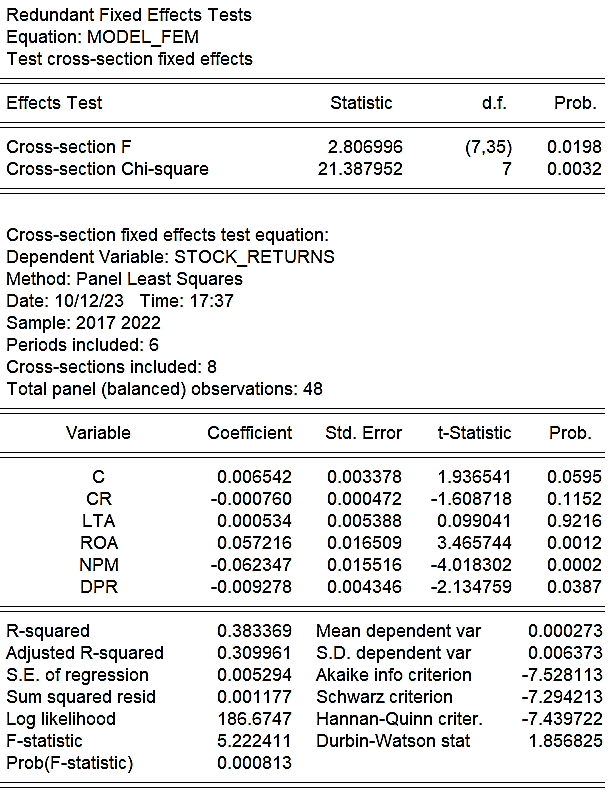
Chow Test (done to the FEM model)
Chow test is a test to determine the model of whether CEM or FEM is most appropriate to estimate the panel data. Based on the output, the Cross-section F is 0.0198, smaller than 0.05, therefore Ho is rejected. FEM is better than CEM.
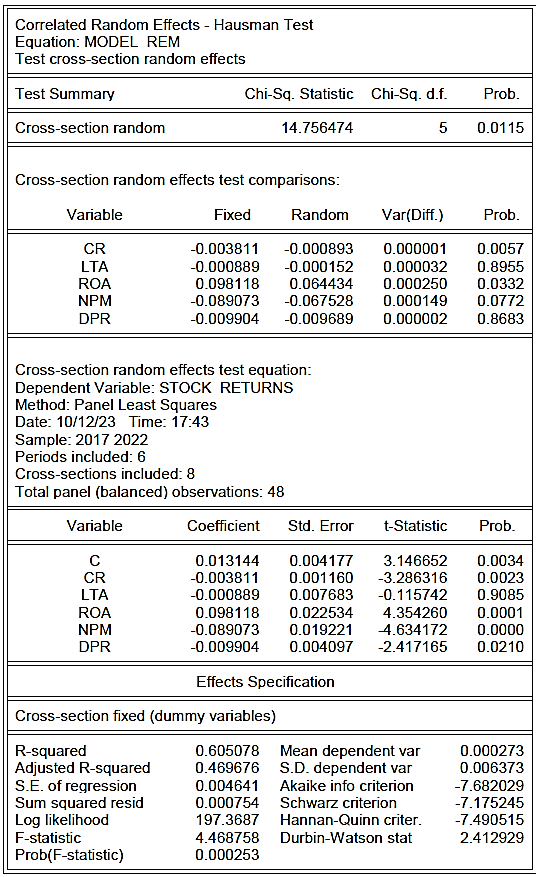
Hausman Test (done to the REM model)
Hausman test is a test to determine the model of whether FEM or REM is most appropriate to estimate the panel data. Based on the output, the Probability (Chi-Square-Statistic) is 0.0115, smaller than 0.05, therefore Ho is rejected. FEM is better than REM.
Figure 7: Result of the Langrange-Multiplier Test
Source: Researcher’s own work
Lagrange-Multiplier Test (Done To The CEM Model)
Lagrange-Multiplier test is a test to determine the model of whether CEM or REM is most appropriate to estimate the panel data. Based on the output, the Probability (Breusch-Pagan) is 0.0333, smaller than 0.05, therefore Ho is rejected. REM is better than CEM.
Based on the three Fixed/Random Effects Testing, the writer would like to choose either the Fixed Effect Model (FEM) or the Random Effects Model (REM) as the chosen model for this thesis. Final conclusion, for the model, will be determined after all the assumption tests have been done.
Goodness of Fit Model
Goodness of Fit Model is done to identify whether the chosen regression model is fit or not to explain the effect of independent variables to the dependent variables. In this case, the goodness of fit analysis will be done to the chosen model, which is the Random Effect Model.
Assumption Tests Summary
The test results for each of the model can be summarized in the following table.
Table 2: Assumption Test Summary
Model
Normality Test
Multicollinearity
Multicollinearity (VIF)
Heterokedasticity (White)
Autocorrelation (Durbin-Watson)
Autocorrelation (Breusch-Godfrey)
FEM
Not Normally Distributed
There is multicollinearity between NPM and ROA
There is multicollinearity between NPM and ROA
No Heterokedasticity
No Autocorrelation
No Autocorrelation
REM
Normally Distributed
Source: Researcher’s Own Work
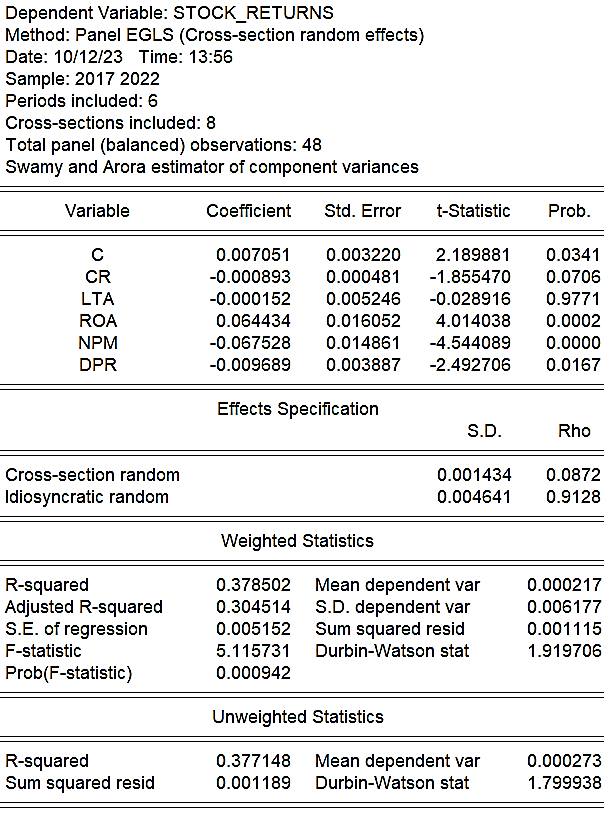
Figure 8: Random Effect Model (The Chosen Model)
Source: Researcher’s own work
Table 3: Assumption Test Summary
Independent Variables
T-Statistic Value
CR
-1.855470
LTA
-0.028916
ROA
4.014038
NPM
-4.544089
DPR
-2.492706
Source: Researcher’s Own Work
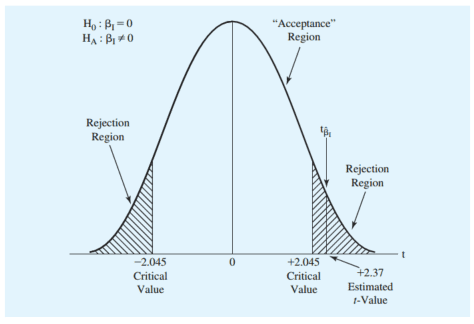
Figure 9: Two-Sided T-test of ROA
Source: Researcher’s own work
Determination Coefficient Analysis (R-Squared):Based on the regression output of Random Effect Model (REM) in the R-Squared value, it is shown that the R-Squared value is 0.378502. It can be derived that the contribution of the selected financial ratios (CR, LTA, ROA, NPM and DPR) as a whole (together) to the variance of Stock Return is in the percentage of 37.8502%, in which the rest of 62.1498% is influenced by other ratios that are not considered in this model.
Hypothesis Test (T Test and F Test): Based on the regression output of the Random Effect Model (REM) in the t-statistic column, it is shown that the t-statistic value of each variables are as below.
Next step is to acquire the t-table value, with the criteria (α) = 0.05, and df (n-k-1) = 48-5-1 = 42, therefore the t-table value is 2.018. In this research, the researcher will use a two-sided T-test. The following figure will help determining the outcome of the test. The researcher has used ROA as an example of conclusion derivation.
The T-statistic value of ROA is +4.014038, while, the T-table as previously stipulated is +2.018, using a two-sided T-test, the critical value of ROA is in the rejection region, therefore, Ho is rejected, ROA has a significant effect to the Stock returns. The same approach will be used for all the independent variables, resulting in a summary as presented in the table below.
Conclusion Based on p-value
Based on the regression output in the Random Effect Model, it is shown that the Prob (T-Statistic) for all independent variables are as per the table no 4
F Test (Simultaneous Hypothesis Test)
Based on the regression output for the Random Effect Model (REM), it is shown that the F-statistic for the regression model is 5.115731. Meanwhile the value of F-table, based on criteria α = 0.05, df1 (total variable-1) = 6-1 = 5, and df2 (n-k-1) = 48-5-1 = 42, therefore the F-table value is 2.43769263. The value of F-statistic (5.115731) is larger than F-table (2.43769263). Based on the decision criteria of F-Test, therefore Ho is rejected. It is therefore can be concluded that CR, LTA, ROA, NPM and DPR, simultaneously, have significant effect to the Stock return of the companies. Based on the regression output in the Random Effect Model, it is shown that the Prob(F-Statistic) is 0.000942, smaller than the α value, which is 0.05. Therefore, it can be concluded that CR, LTA, ROA, NPM and DPR, simultaneously, have significant effect to the Stock Return of the companies.
Table 4: Conclusion of the Two-Sided T-test
Independent Variables
T-Statistic Value
T-Table
Conclusion
CR
-1.855470
-2.018
T-statistic value is in the Acceptance region, accept Ho
LTA
-0.028916
-2.018
T-statistic value is in the Acceptance region, accept Ho
ROA
4.014038
2.018
T-statistic value is in the Rejection region, reject Ho
NPM
-4.544089
-2.018
T-statistic value is in the Rejection region, reject Ho
DPR
-2.492706
-2.018
T-statistic value is in the Rejection region, reject Ho
Source: Researcher’s Own Work
Table 5: Prob (T-Statistic) Table
Independent Variables
T-Statistic P-Value
Conclusion
CR
0.0706
Larger than significant value of 0.05, has no significant effect
LTA
0.9771
Larger than significant value of 0.05, has no significant effect
ROA
0.0002
Smaller than significant value of 0.05, has significant effect
NPM
0.0000
Smaller than significant value of 0.05, has significant effect
DPR
0.0167
Smaller than significant value of 0.05, has significant effect
Source: Researcher’s Own Work
DISCUSSION
The current ratio has a negative and insignificant effect on stock returns. The results of the regression analysis prove this; the significance level is 0.0706, which is more than the threshold of 0.05. Another indicator is the coefficient of the Current Ratio, which is -0.000893, obtained through the multiple regression analysis using the Random Effect Model. This finding is supported by various researchers in previous researches. According to [7], CR is found to be negatively insignificant with share price of consumer companies. Furthermore, according to [8], It is shown that the liquidity variable (CR) does not impact stock returns according to the findings of panel data regression. This demonstrates that the stock returns of the firm will be unaffected by the rise in liquidity.
The ratio of liabilities to assets has a negative and insignificant effect on stock returns. The results of the regression analysis prove this; the significance level is 0.9771, which is more than the threshold of 0.05. Another indicator is the coefficient of the Liabilities to Assets, which is -0.000152, obtained through the multiple regression analysis using the Random Effect Model. This is in line with the study done by [9], in which it is said that a high ratio of liabilities to assets results in high interest expenses and poor profitability, and that businesses will find it challenging to turn a profit due to the high amount of interest that must be paid on their big liability portfolios. The negative correlation between the liability-asset ratio and profitability was validated using data collected from 37 different industrial sectors in the 1995 industrial census, lending credence to this claim. In addition, the liability-asset ratio coefficient was shown to be statistically insignificant in the study's regression analysis.
The stock returns are positively and significantly impacted by return on assets. In the regression output, we can see that the significance value is 0.0002, which is less than 0.05, proving this. Another indicator is the coefficient of the Return on Asset, which is +0.064434, obtained through the multiple regression analysis using the Random Effect Model. This finding is supported by various researchers in previous researches. According to [7], they found that ROA is significant and have positive impact on the share price. The share price is positively correlated with the company's profitability, therefore a rise in profits should be expected. The share price is positively correlated with the company's profitability, therefore a rise in profits should be expected.
The impact of net profit margin on stock returns is negative and statistically significant. This is shown by the results of the regression analysis, which have a significance level of 0.0000, lower than 0.05. Another indicator is the coefficient of the Net Profit Margin, which is -0.067528, obtained through the multiple regression analysis using the Random Effect Model. This finding is supported by various researchers in previous researches. According to [10], From 2015 to 2017, the stock returns of food and beverage firms listed on the Indonesia Stock Exchange were heavily influenced by their Net Profit Margin (NPM). We know that the t-statistic is negative (-2,364) from the data analysis findings. Since the net profit margin's t-test significance value was 0.024, which is lower than the accepted threshold of 0.05, we may infer that it significantly and negatively affects stock returns. Even though net sales have gone down, the firm is still doing well despite the shrinking net profit margin.
There is a negative and statistically significant relationship between the dividend payout ratio and stock returns. Regression results demonstrate this, with a significance level of 0.0167, which is less than 0.05. Another indicator is the coefficient of the Dividend Payout Ratio, which is -0.009689, obtained through the multiple regression analysis using the Random Effect Model. This finding is supported by [11], The study's findings show that the DPR has a substantial effect on the stock price, as the probability's significance value is 0.0000<0.05. The coefficient value of -0.343529 indicates that the DPR has a negative effect on stock returns. Certain investors might believe that companies with high Dividend Payout ratios are reinvesting less of their earnings in growth. This means that they are less likely to develop new products, expand into new markets, or acquire other companies. As a result, their long-term growth prospects may be lower.
CONCLUSION
Return on Assets (ROA), Net Profit Margin (NPM), and Dividend Payout Ratio (DPR) have a significant relationship with stock returns in consumer companies listed on the LQ45 Index for the period February 2023 – July 2023. Furthermore, Current Ratio (CR), Liabilities to Assets (LTA), Return on Assets (ROA), Net Profit Margin (NPM), and Dividend Payout Ratio (DPR) simultaneously have a significant relationship to stock returns in consumer companies listed on LQ45 Index for the period of February 2023 – July 2023 of the index. However, this research found that the Current Ratio (CR) and Liabilities to Assets (LTA) do not have a significant relationship with stock returns in consumer companies listed on the LQ45 Index for the index period of February 2023 – July 2023. The dependent variable of this research (Stock returns) can be explained as much as 37.8502% by the independent variables of this research (Current Ratio (CR), Liabilities to Asset (LTA), Return on Asset (ROA), Net Profit Margin (NPM), and Dividend Payout Ratio (DPR), while the remaining 62.1498% is influenced by other variables outside of this research.
Recommendations
Based on the result of this research, Return on Asset (ROA) and Net Profit Margin (NPM) have a significant effect toward Stock returns. It is important to highlight that both of these financial ratios are profitability ratios. This phenomenon may be elucidated by the correlation between investor behavior and a firm's profitability; that is, investors want information on the firm's capacity to make profits. An upward trend in the company's share price will result from a corresponding growth in profits, which will have a favorable impact on the share price increase. A rise in a company's earnings generates more investor interest in investing via the purchase of shares, which then drives up the stock price and ultimately enhances stock returns. Furthermore, the Dividend Payout Ratio (DPR) has a significant and negative effect toward Stock return. There are multiple possible reasonings for this. Dividend payments might signal the market that the company is not reinvesting its earnings in growth opportunities. Investors may view this as a negative sign, as it suggests that the company is not likely to generate higher earnings in the future. Other possible reason might be that dividend payments are typically made to shareholders who are looking for income, rather than capital appreciation. This means that a high DPR may attract investors who are not interested in holding the stock for the long term. This can lead to lower stock prices and returns.
REFERENCE
PwC Indonesia. "PwC Indonesia economic update: Brace for impact? First quarter 2023." 2023.
Rao, M.E.T., and Thukaram, R.M. "Accounting and financial management for BCA & MCA." New Age International, 2007.
Brigham, E.F., and Ehrhardt, M.C. "Financial management: Theory & practice." 12th ed., Thomson South-Western, 2008.
Bintara, R., and Tanjung, P.R.S. "Analysis of fundamental factors on stock returns." 2019.
Studenmund, A.H. "A practical guide using econometrics." Pearson, 2022.
Zulfikar, R., et al. "Estimation model and selection method of panel data regression: An overview of common effect, fixed effect, and random effect model." JEMA: Jurnal Ilmiah Bidang Akuntansi, vol. 1, no. 10, 2018.
Hashim, S.L.B.M. "Random effect model: Financial ratios and performance of consumer companies in Malaysia." Global Business and Management Research, vol. 12, no. 4, 2020, pp. 477–483.
Arsita, Y., and Sihombing, P. "Analysis of the effect of financial ratio on stock returns of non-cyclicals consumer companies listed on IDX 2015-2020." International Journal of Innovative Science and Research Technology, vol. 6, no. 9, 2021, pp. 1086–1096.
Holz, C.A. "The impact of the liability–asset ratio on profitability in China's industrial state-owned enterprises." China Economic Review, vol. 13, no. 1, 2002, pp. 1–26.
Aminah, L.S. "The effect of current ratio, net profit margin, and return on assets on stock returns: (Study on food and beverages companies listed on the Indonesia Stock Exchange 2015–2017 period)." Journal of Management, Accounting, General Finance and International Economic Issues, vol. 1, no. 1, 2021, pp. 1–9.
Bangun, N., and Natsir, K. "A study on the relationship between enterprise risk management, free cash flow, and dividend payout ratio on stock price of consumer goods." International Conference on Economics, Business, Social, and Humanities (ICEBSH 2021), Atlantis Press, August 2021, pp. 1107–1113.
License
Creative Commons Attribution-NonCommercial-NoDerivatives 4.0 International License
All papers should be submitted electronically. All submitted manuscripts must be original work that is not under submission at another journal or under consideration for publication in another form, such as a monograph or chapter of a book. Authors of submitted papers are obligated not to submit their paper for publication elsewhere until an editorial decision is rendered on their submission. Further, authors of accepted papers are prohibited from publishing the results in other publications that appear before the paper is published in the Journal unless they receive approval for doing so from the Editor-In-Chief.
Himalayan Journal of Economics and Business Management open access articles are licensed under a Creative Commons Attribution-Share A like 4.0 International License. This license lets the audience to give appropriate credit, provide a link to the license, and indicate if changes were made and if they remix, transform, or build upon the material, they must distribute contributions under the same license as the original.
Recommended Articles
Research Article
Influence of Leadership on Poverty Reduction in the Devolved Government in Trans-Nzoia County, Kenya
Kinisu Sifuna,
...
Peter Simotwo
Published: 30/06/2021
Download PDF
Cite
x
APA
Sifuna, K., Lwangale, D. W., Simotwo, P., Sifuna, K., Lwangale, D. W. & Simotwo, P. (2021). Influence of Leadership on Poverty Reduction in the Devolved Government in Trans-Nzoia County, Kenya. Himalayan Journal of Economics and Business Management, 2(1), None-None.
MLA
Sifuna, Kinisu, et al. "Influence of Leadership on Poverty Reduction in the Devolved Government in Trans-Nzoia County, Kenya." Himalayan Journal of Economics and Business Management 2.1 (2021): None-None.
Chicago
Sifuna, Kinisu, David W. Lwangale, Peter Simotwo, Kinisu Sifuna, David W. Lwangale and Peter Simotwo. "Influence of Leadership on Poverty Reduction in the Devolved Government in Trans-Nzoia County, Kenya." Himalayan Journal of Economics and Business Management 2, no. 1 (2021): None-None.
Harvard
Sifuna, K., Lwangale, D. W., Simotwo, P., Sifuna, K., Lwangale, D. W. and Simotwo, P. (2021) 'Influence of Leadership on Poverty Reduction in the Devolved Government in Trans-Nzoia County, Kenya' Himalayan Journal of Economics and Business Management 2(1), pp. None-None.
Vancouver
Sifuna K, Lwangale DW, Simotwo P, Sifuna K, Lwangale DW, Simotwo P. Influence of Leadership on Poverty Reduction in the Devolved Government in Trans-Nzoia County, Kenya. Himalayan Journal of Economics and Business Management. 2021 Jan;2(1):None-None.
Download PDF
Research Article
Modelling Structure Job Quality, Job Design and Job Satisfaction
Moch Nurhadi,
...
Avi Sunani
Published: 30/08/2022
Download PDF
Cite
x
APA
Nurhadi, M., Bisyri Effendi, M., Saiful Ulum, A. & Sunani, A. (2022). Modelling Structure Job Quality, Job Design and Job Satisfaction. Himalayan Journal of Economics and Business Management, 3(2), 1-4.
MLA
Nurhadi, Moch, et al. "Modelling Structure Job Quality, Job Design and Job Satisfaction." Himalayan Journal of Economics and Business Management 3.2 (2022): 1-4.
Chicago
Nurhadi, Moch, Moch Bisyri Effendi, Achmad Saiful Ulum and Avi Sunani. "Modelling Structure Job Quality, Job Design and Job Satisfaction." Himalayan Journal of Economics and Business Management 3, no. 2 (2022): 1-4.
Harvard
Nurhadi, M., Bisyri Effendi, M., Saiful Ulum, A. and Sunani, A. (2022) 'Modelling Structure Job Quality, Job Design and Job Satisfaction' Himalayan Journal of Economics and Business Management 3(2), pp. 1-4.
Vancouver
Nurhadi M, Bisyri Effendi M, Saiful Ulum A, Sunani A. Modelling Structure Job Quality, Job Design and Job Satisfaction. Himalayan Journal of Economics and Business Management. 2022 Jul;3(2):1-4.
Download PDF
Research Article
The Constitutional and Legislative Basis for Considering the Taxable Capacity of Taxpayers in Iraqi Tax Legislation
Hussein Kamel Wadaa
Published: 05/05/2025
Download PDF
Cite
x
APA
Wadaa, H. K. (2025). The Constitutional and Legislative Basis for Considering the Taxable Capacity of Taxpayers in Iraqi Tax Legislation. Himalayan Journal of Economics and Business Management, 6(1), 1-10.
MLA
Wadaa, Hussein Kamel. "The Constitutional and Legislative Basis for Considering the Taxable Capacity of Taxpayers in Iraqi Tax Legislation." Himalayan Journal of Economics and Business Management 6.1 (2025): 1-10.
Chicago
Wadaa, Hussein Kamel. "The Constitutional and Legislative Basis for Considering the Taxable Capacity of Taxpayers in Iraqi Tax Legislation." Himalayan Journal of Economics and Business Management 6, no. 1 (2025): 1-10.
Harvard
Wadaa, H. K. (2025) 'The Constitutional and Legislative Basis for Considering the Taxable Capacity of Taxpayers in Iraqi Tax Legislation' Himalayan Journal of Economics and Business Management 6(1), pp. 1-10.
Vancouver
Wadaa HK. The Constitutional and Legislative Basis for Considering the Taxable Capacity of Taxpayers in Iraqi Tax Legislation. Himalayan Journal of Economics and Business Management. 2025 Jan;6(1):1-10.
Download PDF
Research Article
Proposed Digital Marketing Strategy to Enhance Engineering Consultancy Company Revenue
Alfarisy, K. A.,
Wandebori, H.
Published: 30/04/2024
Download PDF
Cite
x
APA
K. A., A. & H., W. (2024). Proposed Digital Marketing Strategy to Enhance Engineering Consultancy Company Revenue. Himalayan Journal of Economics and Business Management, 5(1), 1-18.
MLA
K. A., Alfarisy, and Wandebori, H.. "Proposed Digital Marketing Strategy to Enhance Engineering Consultancy Company Revenue." Himalayan Journal of Economics and Business Management 5.1 (2024): 1-18.
Chicago
K. A., Alfarisy, and Wandebori, H.. "Proposed Digital Marketing Strategy to Enhance Engineering Consultancy Company Revenue." Himalayan Journal of Economics and Business Management 5, no. 1 (2024): 1-18.
Harvard
K. A., A. and H., W. (2024) 'Proposed Digital Marketing Strategy to Enhance Engineering Consultancy Company Revenue' Himalayan Journal of Economics and Business Management 5(1), pp. 1-18.
Vancouver
K. A. A, H. W. Proposed Digital Marketing Strategy to Enhance Engineering Consultancy Company Revenue. Himalayan Journal of Economics and Business Management. 2024 Jan;5(1):1-18.
Bernike Hutapea, I. & Murtaqi, I. (2023). The Relationship Between Selected Financial Ratios and Stock Returns of Publicly Listed Consumer Companies in LQ45 Index. Himalayan Journal of Economics and Business Management, 4(2), 1-7.
MLA
Bernike Hutapea, Irene and Isrochmani Murtaqi. "The Relationship Between Selected Financial Ratios and Stock Returns of Publicly Listed Consumer Companies in LQ45 Index." Himalayan Journal of Economics and Business Management 4.2 (2023): 1-7.
Chicago
Bernike Hutapea, Irene and Isrochmani Murtaqi. "The Relationship Between Selected Financial Ratios and Stock Returns of Publicly Listed Consumer Companies in LQ45 Index." Himalayan Journal of Economics and Business Management 4, no. 2 (2023): 1-7.
Harvard
Bernike Hutapea, I. and Murtaqi, I. (2023) 'The Relationship Between Selected Financial Ratios and Stock Returns of Publicly Listed Consumer Companies in LQ45 Index' Himalayan Journal of Economics and Business Management 4(2), pp. 1-7.
Vancouver
Bernike Hutapea I, Murtaqi I. The Relationship Between Selected Financial Ratios and Stock Returns of Publicly Listed Consumer Companies in LQ45 Index. Himalayan Journal of Economics and Business Management. 2023 Jul;4(2):1-7.



 Download PDF
 Download XML